Coolant Flow analyses
The Coolant Flow analysis analyzes the fluid behavior in the cooling circuit without the additional time required to analyze the part and mold.
Use the Coolant Flow analysis to design the layout and properties of your cooling channel network, to optimize their performance and to contain costs.
Use this analysis to check the effect of minor losses from different circuit components, or to compare the default friction factors calculated by the software for your setup with those you enter specific for your circuit design. In addition, you can check to see how the temperature changes after a certain point that you define. For in parallel channels, check to ensure that the coolant leaving each outlet is at the same temperature.
Limitations
The Coolant Flow analysis is available for Beam elements only. For 3D channels, extract the channel center lines and mesh as beam elements.
Coolant Flow results
Two new results are generated from this analysis:
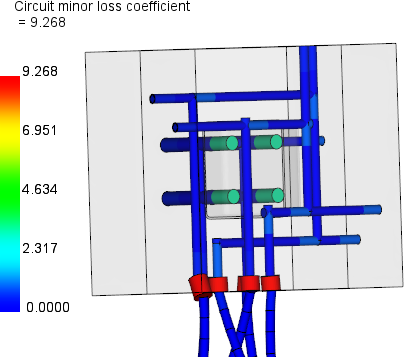
Circuit minor loss result
The circuit minor loss, or the K factor, is the resistance to flow that occurs in the cooling circuit as a consequence of every elbow, bend, T Junction, expansion, contraction, etc. To obtain an accurate result, enter the K factor for each circuit component, as provided by the component manufacturer. Otherwise, you can look up generic values in books, but the result is less accurate. If you don't enter a K factor, the solver calculates a generic value. If you enter a value, the solver ignores the generic calculation and uses the data you enter. Use this result to:
- Compare the result against the result when the solver calculates a generic value, to see how accurately the generic value simulates your circuit minor losses
- Decide whether to ignore the circuit minor losses
- Verify whether the result is sufficiently accurate if you only specify the minor loss in a complex branch region, and let the solver calculate the minor losses in the rest of the circuit.
Circuit friction factor result
The friction factor determines the frictional losses in the circuit, and is dependent upon the equivalent sand grain roughness factor (e/D) of the channel and the Reynolds number, Re, of the fluid flowing through it. The Moody diagram correlates the Reynolds number, and pipe roughness to a friction factor, empirically, but there are several semi-empirical correlation formulae that can be used to reduce the Moody diagram to a programmable form, for different Reynolds number ranges. The default is the Swamee-Jain equation. Use this result to:
- Compare the solver’s results directly to the Moody diagram, if you experiment with pipe roughness or different flow rates
- Compare the level of accuracy of the other approximations before choosing one for using for their Cool analyses