Simulation Settings Dialog Box
The Settings button on the Simulate tab provides access to the Simulation Settings dialog box.
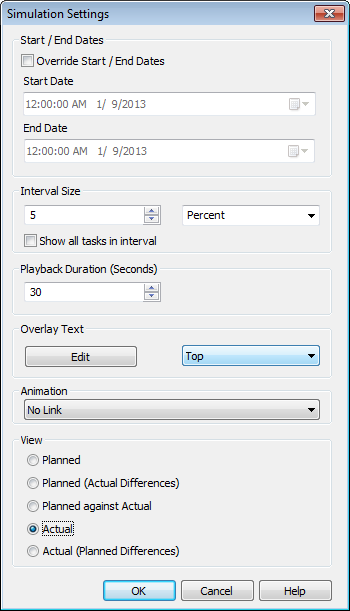
It is possible to override the Start and End dates that the simulation runs between. Selecting the Override Start/End Dates check box enables the date boxes and allows you to choose the start and end dates. By doing this, you can simulate a small sub-section of the overall project. The dates will be shown on the Simulate tab. These dates will also be used when exporting animations.
You can define the Interval Size to use when stepping through the simulation using the playback controls. The interval size can be set either as a percentage of the overall simulation duration or to an absolute number of days or weeks, and so on.
Use the drop-down list to select the interval unit, then use the Up and Down arrow buttons to increase or decrease the interval size.
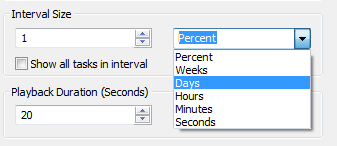
It is also possible to highlight all the tasks that are being worked on during the interval. By selecting the Show All Tasks in Interval check box, and, for example, setting the Interval Size to 5 Days, all tasks being worked on during those 5 days will be set to their Start Appearance in the Scene View, including those that begin and end within the bounds of the interval. The Simulation slider will show this by drawing a blue line under the slider. If this check box is clear, tasks that begin and end within the bounds of the interval will not be highlighted in this manner, and will need to overlap with the current date in order to be highlighted in the Scene View.
You can define the overall Playback Duration for the complete simulation (the time needed to play it through from start to finish). Use the Up and Down arrow buttons to increase or decrease the duration (in seconds). You may also enter a duration directly into this field.
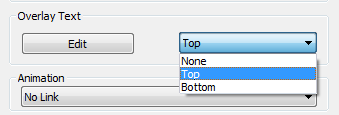
You can define whether the current simulation date should be overlaid in the Scene View, and if so whether it should appear at the top or bottom of the screen. From the drop-down, choose from None (to display no overlay text), Top (to display the text at the top of the window), or Bottom (to display the text at the bottom of the window).
You can Edit the information displayed in the overlay text using the Overlay Text Dialog Box. This dialog box also makes it possible to alter the Font Type, Style and Size by clicking on the contained Font button.
You can add animation to an entire schedule, so that during the TimeLiner sequence playback, Navisworks will also play the specified viewpoint animation or camera.

The following options can be selected in the Animation field:
- No Link - no viewpoint animation or camera animation will be played.
- Saved Viewpoints Animation - links your schedule to the currently selected viewpoint or viewpoint animation.
- Scene X - >Camera - links your schedule to a camera animation in the selected animation scene.
You can pre-record suitable animations for use with the TimeLiner simulation (see Record and Play Back Animations). Using animation also affects the Animation Export.
You can view pre-recorded animations with the TimeLiner simulation (see Play Animations and Scripts).
View area. Each view will playback the schedule depicting Planned and Actual relationships:
Actual. Choose this view to simulate the Actual schedule only (that is, only use the Actual Start and Actual End dates).
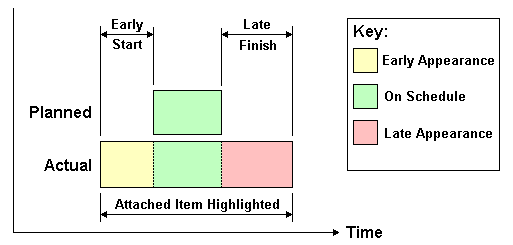
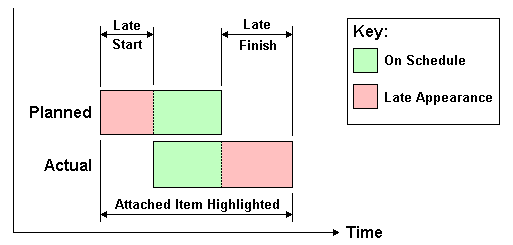
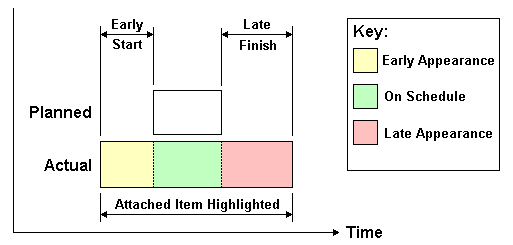
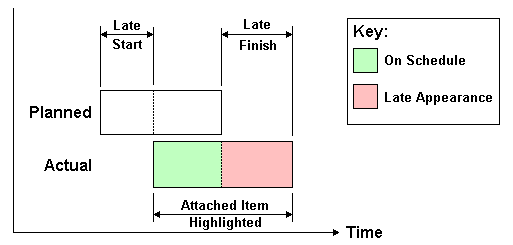
Actual (Planned Differences). Choose this view to simulate the Actual schedule against the Planned schedule. This view will only highlight the items attached to the task over the Actual date range (that is, between Actual Start and Actual End. See diagram below for graphical representation). For time periods where the Actual dates are within the Planned dates (on schedule), the items attached to the task will be displayed in the Task Type Start Appearance. For time periods where the Actual dates are early, or late in comparison to the Planned dates (there is a variance), then the items attached to the task will be displayed in the Task TypeEarly or Late Appearance, respectively.
Planned. Choose this view to simulate the Planned schedule only (that is, only use the Planned Start and Planned End dates).
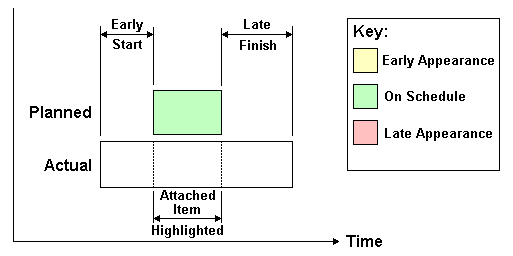
Planned (Actual Differences). Choose this view to simulate the Actual schedule against the Planned schedule. This view will only highlight the items attached to the task over the Planned date range (that is, between PlannedStart and Planned End. See diagram below for graphical representation). For time periods where the Actual dates are within the Planned dates (on schedule), the items attached to the task will be displayed in the Task TypeStart Appearance. For time periods where the Actual dates are early, or late in comparison to the Planned dates (there is a variance), then the items attached to the task will be displayed in the Task TypeEarly or Late Appearance, respectively.
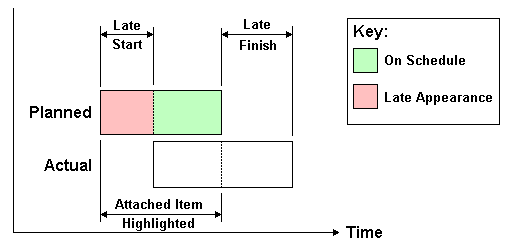
Planned Against Actual. Choose this view to simulate the Actual schedule against the Planned schedule. This will highlight the items attached to the task over the entire Planned and Actual date range (that is, between the earliest of Actual and Planned Start dates and the latest of Actual and PlannedEnd dates. See diagrams below for graphical representation). For time periods where the Actual dates are within the Planned dates (on schedule), the items attached to the task will be displayed in the Task Type Start Appearance. For time periods where the Actual dates are early, or late in comparison to the Planned dates (there is a variance), then the items attached to the task will be displayed in the Task Type Early or Late Appearance, respectively.
