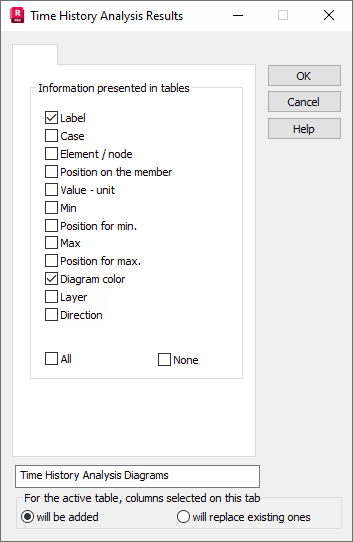
Right click in the table below the presented diagrams and select Columns to select quantities for time history analysis. The option is available only for time history analysis.

The options describe the presented diagram and allow one to display the extreme values obtained for the structure.