- Access
-
- Click Results
 Advanced
  Capacity Curve.
- Click Results
The option displays the following diagrams:
- Reaction sum in the control direction in a node displacement function in the controlled direction
- Spectral acceleration in the spectral displacement function - the diagram is derived from the diagram above after converting it appropriately to the spectral space (see code ATC-40 chapter 8.2.2.1.1)
Based on the capacity spectrum, the performance point is calculated (code ATC 40 chapter 8.2.2.1.3), which determines the structure response (maximal displacements) to the specified ground movement caused by an earthquake.

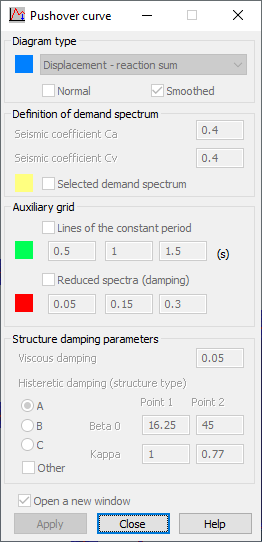
The dialog lets you select 1 of the following types of diagrams:
- Displacement - reaction sum (when selected, all options in the dialog are unavailable)
- Capacity spectrum
- Damping - period (effective) (when selected, all options in the dialog are unavailable)
The options: Normal and Smoothed are available only for the Capacity spectrum diagram. Selecting the Smoothed option results in smoothing the diagram that is displayed.
In the Definition of demand spectrum field, you can determine the demand spectrum (spectrum of ground movements during an earthquake). The demand spectrum is defined using the seismic coefficients Ca and Cv. (See code ATC-40 Chapter 4.) Selecting the Selected demand spectrum option displays a diagram created out of the intersections of the constant period lines with the appropriately calculated reduced spectra.
The options in the Auxiliary grid field include:
- Lines of the constant period - Selecting this option displays constant period lines. Values entered in the appropriate fields must be positive.
- Reduced spectra (damping) - Selecting this option displays the reduced spectrum grid. In the available fields, you can define damping values falling in the range of <0, 1>, that are applied to determine the reduced spectra. Entering 0 denotes a damping value of 0%; whereas, entering the 1 indicates a damping value of 100%.
In the Structure damping parameters field, you can define 2 types of structure damping:
- Internal (viscous)
- Histeretic (structure behavior type)
For the histeretic damping, the structure type (A, B, or C) is selected. The parameters Beta0 and Kappa (applied to calculate the effective damping) are calculated by Robot and are displayed in the proper fields on a gray background. You can also specify these values if the Other option is selected. The fields for Point1 and Point2 become available. Values of the Beta0 and Kappa coefficients must be positive.
After defining the enumerated parameters and clicking Apply, a relevant diagram is displayed.
After the Displacement - reaction sum diagram is selected, the following information is displayed:
- The graphical part displays a diagram of the reaction sum in the control displacement function (reaction sum can be a force or a moment; whereas, displacement can be a displacement or a rotation angle.)
- The tabular part displays a table with the following columns (the number of table rows equals the number of steps in a given pushover analysis case):
- Step - Successive numbers of iteration steps.
- Reaction sum - Reaction sum at each step.
- Displacement - Displacement of a control node at each step.
- Range A-B, B-IO, and so on - The number of non-linear hinges included within the given range at individual steps.
- A, B, IO, and so on - Acceptance criteria defined in the Definition of non-linear hinge model dialog (the Parameters tab).
After the Capacity spectrum diagram is selected, the following information is displayed:
- The graphical part displays a capacity spectrum diagram or if the appropriate options have been specified, a diagram of the demand spectrum, constant period lines and performance point.
- The tabular part displays a table with the following columns:
- 1 set (the table has only one row):
The column with no name has a description of the Performance point.
U, V - Point coordinates in the Displacement - Reaction sum system.
Sd, Sa /g - Point coordinates in the Spectral displacement - Spectral acceleration system.
Beff, Teff - Point coordinates in the Effective damping - Effective period system.
- 2 set (the number of table rows equals the number of steps in a given pushover analysis case):
Step - Successive numbers of iteration steps
Teff - Values of effective period at each step
Beff - Values of effective damping at each step
Alpha - Effective mass coefficient at each step
PF - Modal participation factor at each step.
- 1 set (the table has only one row):
After right-clicking inside the table, a shortcut menu is displayed. (It operates in the same way as the time history analysis). The shortcut menu also includes the following options (Diagrams - properties menu)
- Automatic range - When selected, the diagram is drawn throughout the total time range of the analysis.
- User-defined range - When selected, the diagram is drawn throughout the range defined by the user (using the cursor on the diagram).