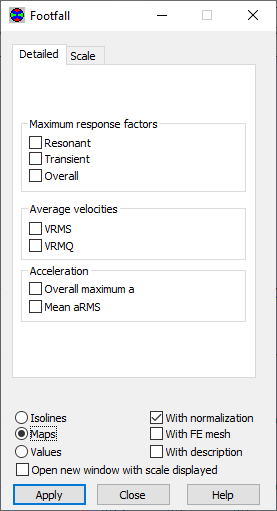
Using this option, you can display results of the Footfall analysis as maps on bars and panels; access the option by selecting Results menu > Advanced > Footfall Analysis - Maps option.

You can select the following maps in the dialog:
- maximum response factors (for the resonant and transient response analyses)
- mean velocities (RMS, RMQ)
- acceleration (overall maximum, mean aRMS).
The mean acceleration value aRMS (Root Mean Square) is:

Maps display the maximum result from the specified footfall frequency for each node.
You can display results as isolines or color maps on selected elements. Selecting the Values option selects automatically the With description option (which displays as gray then).
You can display only one quantity in the window. To display a map of a different quantity:
- Select this quantity and click OK. A map of the selected quantity replaces a map displayed in the window.
- Select this quantity and select the Open new window with scale displayed option. A map of the selected quantity displays in a new window; the previous map remains on screen.
You can display maps or isolines using one of 3 options: with description, with normalization and with FE mesh. If you select With FE mesh, the map of a selected quantity and a generated finite element mesh display.