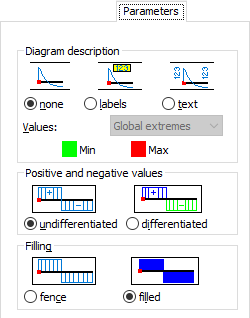
When the Parameters tab is selected on the Diagrams for Core Walls dialog, the following displays:

You can select a method for displaying the diagrams on structures in this dialog.
- Diagram Description field lets you decide how descriptions of quantities are presented in a diagram:
- None - Descriptions in the diagrams of quantities in the Diagrams dialog are not displayed.
- Labels - Descriptions in the diagrams of quantities available in the Diagrams dialog are displayed as labels showing values at selected points on the bars. Labels are shifted slightly away from the diagrams.
- Text - Descriptions in the diagrams of quantities available in the Diagrams dialog are displayed as values at selected points on the bars. Descriptions are positioned perpendicular to the bar.
- Values - for the two options (labels and text), you can use the Values selection field to limit the number of diagram descriptions displayed. The following options are available:
- All - Diagram descriptions are displayed for each calculated element: at its beginning and end points, as well as the points of maximum and the minimum value.
- Global extremes - Descriptions are displayed only for the global maximum and minimum values, thus displaying extreme values for the whole structure.
- At the bottom of the Diagram description field, the Max and Min options let you select a color for labels and the description of the maximum and minimum values on a diagram. (A color can also be selected in the Preferences dialog from the Desktop Settings tab > plate diagrams > minimum > maximum values.
- The Positive and Negative Values fields let you determine if positive and negative values of the displayed quantity should be differentiated by color in the diagrams.
- Undifferentiated - when selected, the quantities diagrams from the Diagrams dialog are displayed without distinguishing between positive and negative values
- Differentiated - when selected, the quantities diagrams from the Diagrams dialog are displayed so that positive and negative values can be distinguished.
- Filling determines the filling of a diagram.
- Fence - When selected, the quantities diagrams from the Diagrams dialog will be fence type. The diagram is filled with ordinates at every step.
- Filled - When selected, the quantities diagrams from the Diagrams dialog are filled with the selected color.