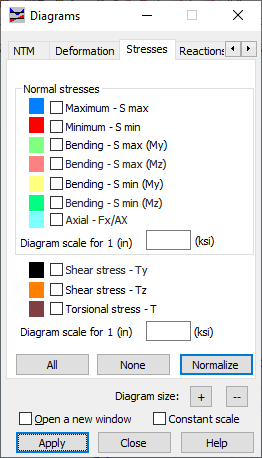
After the Stresses tab is selected in the Diagrams for Members dialog, the following displays.

Diagrams will be displayed for the quantities that you select in this dialog:
- Normal stress:
- Maximum - when selected, the diagram of the maximum normal stress displays. Values of maximum stresses from consecutive bar sections can be taken from different points of the cross section.
- Minimum - when selected, the diagram of the minimum normal stress displays. Values of minimum stresses from consecutive bar sections can be taken from different points of this lateral section.
- Bending max MZ - when selected, the diagram of the maximum bending stress for moment MZ displays.
- Bending max MY - when selected, the diagram of the maximum bending stress for moment MY displays.
- Bending min MZ - when selected, the diagram of the minimum bending stress for moment MZ displays.
- Bending min MY - when selected, the diagram of the minimum bending stress for moment MY displays.
- Axial FX/SX - when selected, the diagram of axial stresses displays.
- Shear stresses Y - when selected, the diagram of shear stress (Y-axis) displays.
- Shear stresses Z - when selected, the diagram of shear stress (Z-axis) displays.
- Torsional stresses - when selected, the diagram of torsional stress displays.
You can select an appropriate color for each of these quantities. You can also define the scale of the diagram for each group of stresses.
The buttons include the following:
- All - Displays the diagrams of all the quantities.
- None - Hides the diagrams.
- Normalize - Displays the diagram of a selected quantity in such a way that the scale is adjusted to the maximum and minimum value of the highlighted quantity.
See also: