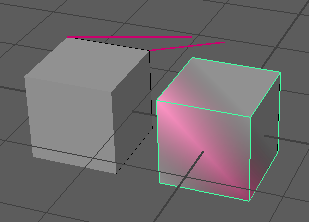
ビューポート 2.0(Viewport 2.0)では、ポリゴンの頂点、エッジ、フェース、頂点フェースに割り当てられたメタデータを視覚化することができます。「ビューポート 2.0 (Viewport 2.0)でメタデータを視覚化する」も参照してください。
オブジェクトのコンポーネント(この例の場合は頂点)にメタデータを追加して、showMetadata コマンドを使用してメタデータを視覚化するには、これらのガイドラインに従います。
メタデータの視覚化に showMetadata コマンドを使用すると、さまざまなオブジェクトにさまざまなストリームとメンバーの組合せを表示することができますが、各オブジェクトのストリームとメンバーは 1 つのみです。たとえば、Object1 に StreamOne を視覚化し、同時に Object2 に StreamTwo を視覚化することができますが、Object1 に StreamOne と StreamTwo の両方を同時に視覚化することはできません。
-
オブジェクトにメタデータを追加するには、次のように、まず dataStructure コマンドを使用してデータ構造を定義し、addMetadata コマンドを使用してデータストリームを作成してオブジェクトにアタッチすることができます。
// Define the data structure and create a data stream called StreamOne
dataStructure -format "raw" -asString "name=ColorStruct:float[3]=Color";
addMetadata -streamName "StreamOne" -channelName "vertex" -structure "ColorStruct" smcPlaneShape smcPlane1Shape;
注:メタデータは、変形したメッシュに追加できません。
通常、ハード エッジの修正などの polyShape の inMesh アトリビュート(つまり、polyShape ノードの入力アトリビュート)のトポロジの変更操作では、同じ方法で入力メタデータは修正されず、予期しない結果が発生する可能性があります。
-
指定されたコンポーネントのメタデータ ストリームに値を割り当てるには、editMetadata コマンドを使用します。ストリームでメタデータの値を定義するには -value フラグを使用し、メタデータに適用する頂点を指定するには -index フラグを使用します。
// Set StreamOne values and assign StreamOne to specified vertices on smcPlaneShape
editMetadata -streamName "StreamOne" -value 2 -value 0.5 -value 1 -index 1 smcPlaneShape;
注:あるいは、最初に頂点を選択することで、頂点にメタデータを割り当てることもできます。
select -r smcPlane.vtx[2:3];
editMetadata -streamName "StreamOne" -value 2 -value 0.5 -value 1;
上記は下記に相当します。
editMetadata -streamName "StreamOne" -value 2 -value 0.5 -value 1 -index 2 -index 3 smcPlaneShape;
- メタデータを視覚化するには showMetadata コマンドを使用して表示するストリーム、メンバー、メンバーのデータ型を指定し、メタデータを表示するモードを指定するには -method フラグを使用します。モードを指定しない場合は、カラー モードが使用されます。
// Visualize StreamOne on smcPlaneShape
showMetadata -stream "StreamOne" -member "Color" -dataType "float[3]" -method "string" smcPlaneShape;
- ビジュアライゼーションを無効にするには、ストリーム名を指定して、off フラグを使用します。
オブジェクト名を指定すると、そのオブジェクトのビジュアライゼーションのみを無効化することができます。オブジェクト名を指定しなくて、シーン内でどのオブジェクトも選択していない場合は、指定されたストリームおよびメンバーのすべてのオブジェクトのビジュアライゼーションが無効化されます。
showMetadata -stream "StreamOne" -off -member "Color" -dataType "float[3]" smcPlaneShape;
次の例に、2 つのオブジェクト(smcPlane と smcPlane1)の頂点に 2 つのメタデータのストリーム(StreamOne と StreamTwo)をアタッチする方法と、ビューポート 2.0(Viewport 2.0)でデータストリームを 1 つずつ視覚化する方法を示します。ビジュアライゼーションを無効化することで、表示されます。
// Start a new scene and create two cubes
file -new -f;
polyCube -n smcPlane -ch off;
pickWalk -d down;
move -r 1.5 0 0 ;
polyCube -n smcPlane1 -ch off;
pickWalk -d down;


// Define the data structure and create and attach the data streams to the two shapes
dataStructure -format "raw" -asString "name=ColorStruct:float[3]=Color";
addMetadata -streamName "StreamOne" -channelName "vertex" -structure "ColorStruct" smcPlaneShape smcPlane1Shape;
addMetadata -streamName "StreamTwo" -channelName "vertex" -structure "ColorStruct" smcPlaneShape smcPlane1Shape;


// Assign metadata values to the two streams
editMetadata -streamName "StreamOne" -value 0.25 -value 1.25 -value 2 -index 1 smcPlaneShape;
editMetadata -streamName "StreamTwo" -value -2 -value -0.5 -value 2.5 -index 2 smcPlaneShape;
editMetadata -streamName "StreamTwo" -value -4 -value -0.5 -value 2.5 -index 3 smcPlaneShape;
editMetadata -streamName "StreamTwo" -value -1.25 -value -0.75 -value 3 -index 4 smcPlane1Shape;
editMetadata -streamName "StreamOne" -value 6 -value 2 -value 3.5 -index 5 smcPlane1Shape;
editMetadata -streamName "StreamOne" -value 2 -value 0.5 -value 1 -index 6 smcPlane1Shape;


// NOTE: By default, all streams are hidden.
// Activate visualization of "StreamOne" for one cube. Use color mode.
showMetadata -stream "StreamOne" -member "Color" -dataType "float[3]" -method "color" smcPlane1Shape;

// Metadata is now visible.
// Auto remap the data range of the values in the stream.
showMetadata -stream "StreamOne" -member "Color" -dataType "float[3]" -method "color" -auto smcPlane1Shape;

// Enable color interpolation to extrapolate color to the faces surrounding the vertices
showMetadata -stream "StreamOne" -member "Color" -dataType "float[3]" -method "color" -interpolation true smcPlane1Shape;

// Activate visualization of "StreamOne" for the other cube. Use string mode.
showMetadata -stream "StreamOne" -member "Color" -dataType "float[3]" -method "string" smcPlaneShape;

// Metadata is now visible on both cubes.
// Now, activate visualization of "StreamTwo" for the second cube. Use ray mode.
showMetadata -stream "StreamTwo" -member "Color" -dataType "float[3]" -method "ray" smcPlaneShape;

// The rays appear too long.
// Scale the length using the rayscale flag.
showMetadata -stream "StreamTwo" -member "Color" -dataType "float[3]" -method "ray" -rayScale 0.3 smcPlaneShape;

// The visible metadata has now changed, and you have now used all three methods of display.
// Deactivate the stream.  To turn off visualization on an object, specify the stream name and use the off flag.
showMetadata -stream "StreamTwo" -member "Color" -dataType "float[3]" -off smcPlaneShape;

// Now metadata is no longer visible on the second cube (smcPlaneShape)
この例では、StreamTwo はレイの長さスケール(Ray length scale)を 0.3 に設定した X 線モードで smcPlaneShape 上に視覚化され、StreamOne はデータ範囲が自動的に再マップされ、カラー補間が有効なカラーモードで smcPlane1Shape 上に視覚化されます。

showMetadata コマンドで使用できるフラグの詳細については、テクニカル ドキュメントの MEL コマンドと Python コマンドのセクションを参照してください。
マーキング メニューまたはメタデータの視覚化オプション(Metadata Visualization Options)を使用せず、このスクリプト メソッドを使用して 2 つのストリームのみを同時に視覚化できます。