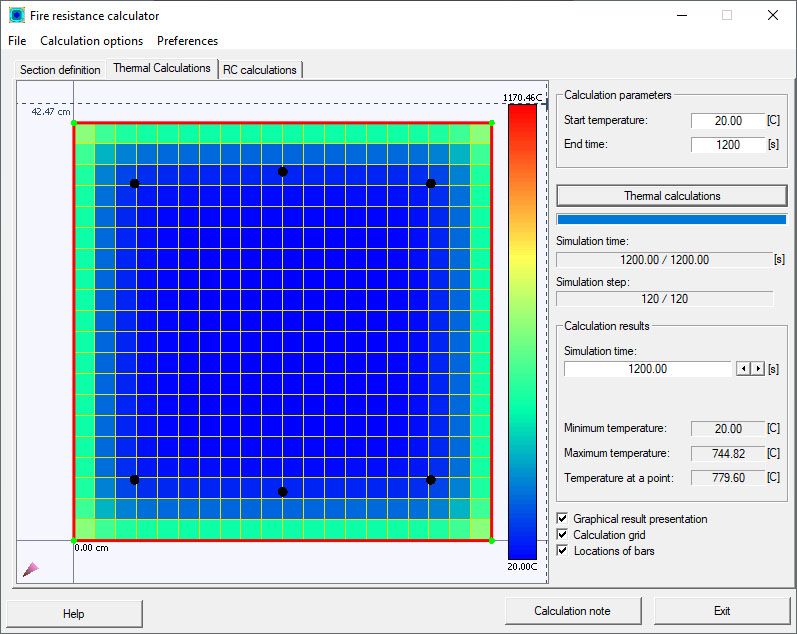
The Thermal Calculations tab defines calculations and viewing results of thermal calculations.

The top of the dialog consists of two options.
- Start temperature (for defining the initial temperature for thermal calculations).
- End time (for defining the time of finishing thermal calculations).
Click Calculations to start thermal calculations for a section. The calculation process is represented graphically in the cross section of an RC element (Graphical result presentation must be selected). Progress is represented by the progress bar and changing values of the simulation time and simulation step (see Parameters of thermal calculations).
Calculation results are presented in the cross section of an RC element. The Calculation results field selects any time from the interval determined by the start time (zero) and the end time (defined in the top part of the dialog). The following section data is given for a selected time.
- Minimum temperature.
- Maximum temperature.
- Temperature at a point.
Results of thermal calculations are presented in the form of maps in the cross-section (graphical result presentation must be selected). The presented map is accompanied by the scale. The scale is chosen automatically depending on the values of the maximum and minimum temperature.
The following options are also available in the lower part of the dialog.
- Calculation grid - A grid with parameters defined in the Thermal Calculation Parameters dialog is presented in a section.
- Locations of bars - Reinforcing bars calculated in the Robot RC module are presented in a section.