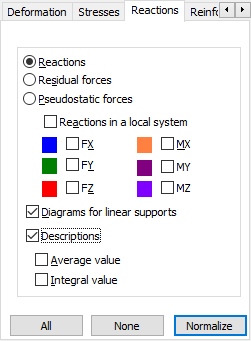
After the Reactions tab is selected in the Diagrams for Members dialog, the following displays:

You can select the following to be displayed from this dialog:
- Reactions - values of reaction forces at supports and reaction moments - values of moments at supports
- Residual forces - sums of forces at individual structure nodes (check of the equilibrium of forces in structure nodes) and residual moments - sums of moments at individual structure nodes (check of the equilibrium of moments in structure nodes)
- Pseudostatic forces - forces from a simple load case generated on the basis of a seismic or spectral analysis case mode.
Forces and moments are displayed using the global coordinate system.
The dialog also has the following options:
- Reactions in a local system. When selected, you can display the forces in an inclined coordinate system (if a structure support is inclined in relation to the directions of a global coordinate system). When this option is cleared, reactions are presented using the global coordinate system.
- Diagrams for linear supports. When selected, diagrams are displayed for supports; otherwise, only nodal forces are displayed. After Diagrams for linear supports is selected, the Average value and Integral value options can be selected.
- Integral value. When selected, the value of the integral, that is the sum of reaction forces along the edge, is displayed. The unit of linear reactions is force/length, therefore, the unit of the integral is a force.
- Average value. When selected, the average value of a diagram is displayed. The average value is calculated as the sum (integral) of reactions along the length of the support edge divided by the length of a specified edge. The unit of the average value of a linear reaction is force/length.
You select the colors for these diagrams from the Preferences dialog. You can also change colors for individual components of a reaction clicking the color fields next to reaction component options in the Diagrams dialog.