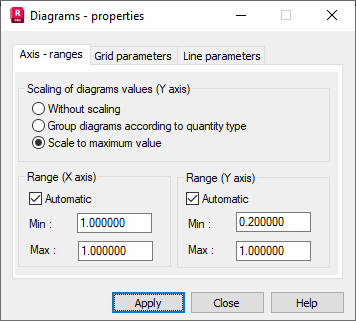
The following dialog is displayed after the Axis - ranges tab is selected in the Diagrams - properties dialog.

At the top of the dialog, you can specify the method of diagram scaling:
- Without scaling - When selected, each diagram is scaled independently. (Each diagram is drawn in its domain.)
- Group diagrams according to quantity type - When selected, each diagram is scaled considering division into quantity types (displacements, forces, and so on), such as, diagrams of displacements are scaled to the <min, max> values from all displacement diagrams.
- Scale to maximum value - When selected, the diagrams are scaled to the minimum and maximum values from all diagrams.
Axis descriptions are presented on the Y axis. These are the descriptions of two first functions from the list presented in the Advanced analysis dialog.
Note: The Y axis range can be changed only if the scale to maximum value option is selected. If not, the options for the Y axis range are unavailable.
If the Automatic option is turned off for X or Y axis, the Min and Max fields become available, which allows you to define the minimum and maximum values for diagrams.