- In Visual Studio Code, start debugging an AutoLISP source (LSP) file.
- Set one or more breakpoints to interrupt the execution of the program.
For information on setting breakpoints, see To Add, Remove, or Disable a Breakpoint while Debugging an LSP File.
- On the Activity Bar, click Debug and Run (or click View menu > Debug).
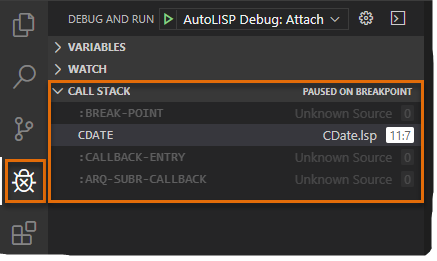
Calls made are shown in the Call Stack section of the Debug and Run view.