Visualize the Flow
At this point, we are looking at the exterior surfaces of the enclosure. They appear blue because the current result is velocity magnitude, and the velocity on the walls is 0 in/s.
We need to go inside the model to see what's really happening.
To do this, we'll use some powerful visualization tools: results planes and iso surfaces. With these we can visualize the flow inside the enclosure.
1. To start, click Results (tab) > Results Tasks (panel) > Planes.

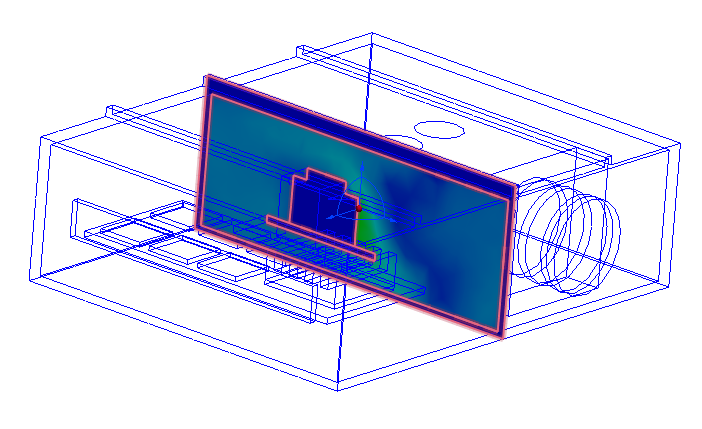
2. To create a plane, click Add on the Planes context panel.

You should see this:
3. To rotate the plane, left click on it, and click Y from the Context dialog:
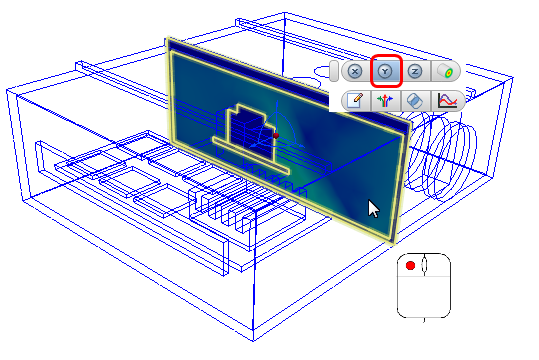
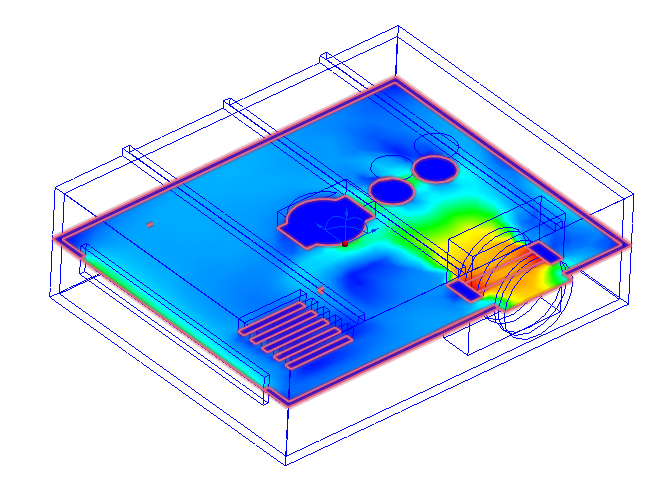
You should see this:
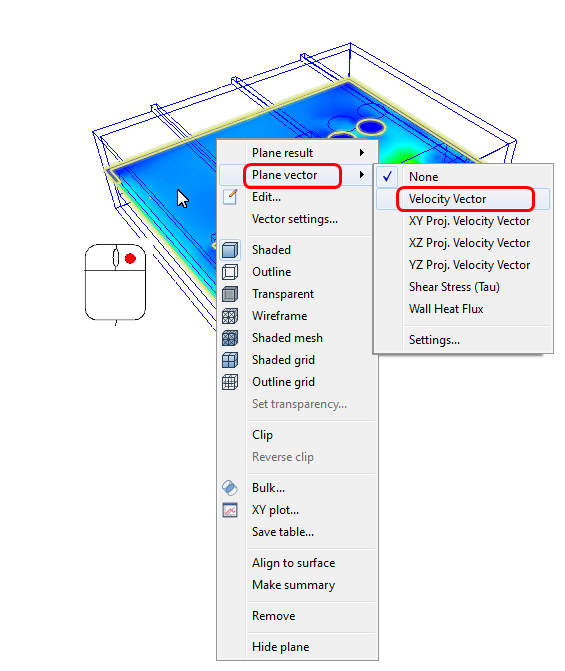
4. To show vectors on the plane, right click, and select Plane vector. Click Velocity Vector:
5. Until you view the plane as an outline, the vectors are difficult to see. Right click, and select Outline:
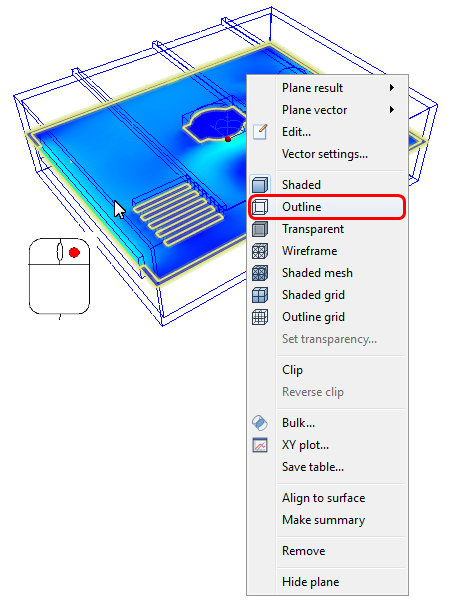
You should see this:

6. To improve the view, shade the internal components:
- a. Change the visual style to Shaded, from the Quick Access toolbar.
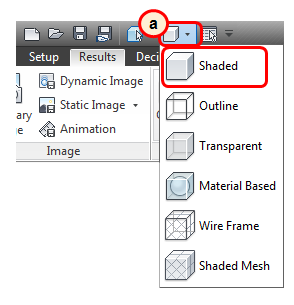
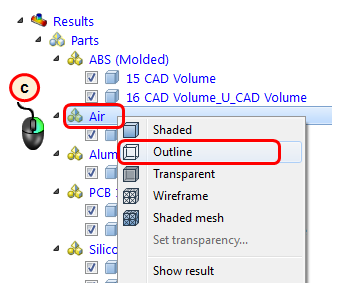
- b. To display the casing and the air as outline, right click on the casing part which is listed as 15 from the Results > Parts > ABS (Molded) branch of the Design Study bar, and click Outline.

- c. Right click on Results > Parts > Air, and click Outline.
You should see this:
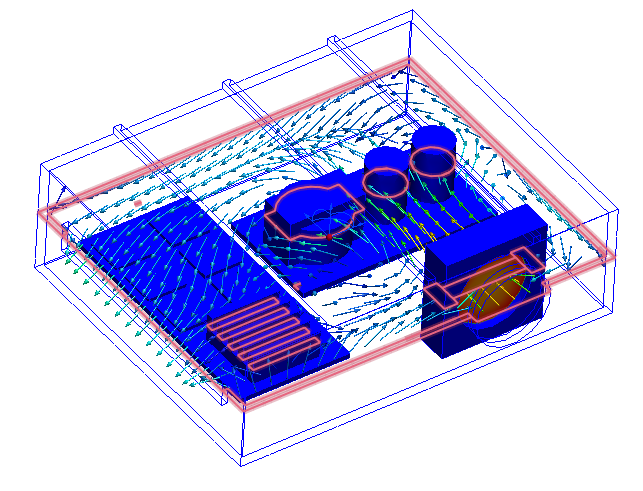
This is a good view of the flow through the enclosure. Notice the recirculation to the left of the fan. This air probably does not cool the components. Notice also the strong jet that flows over the transformer and capacitors. After impinging on the back surface, the jet flows over the six chips on the PCB.
In the next step, we view temperature results...