Use mass haul diagrams to display earthwork volumes along an alignment, based on sectional volume computation.
A mass haul diagram presents a graphical view of material moved in the proposed design site, displaying balance points, free haul and overhaul regions, and gradient points.
The use of mass haul diagrams helps designers and contractors understand where gross material movements occur and as key indicators used to compare the economies of alternative designs. These diagrams are typically presented along with profile views for design review. They are used to analyze the following aspects of the design:
- Distance over which the cut and fill will balance
- Amount of material to be moved and the direction of movement
- Identification of borrow pits and dump sites
To generate mass haul diagrams, you need an alignment, a sample line group, and a list of materials.
Mass haul diagrams are graphed with chainages (sample lines) along the x-axis and cumulative material (typically earthworks) volume on the y-axis. The middle axis (zero cumulative volume) line is called the balance line. When the mass haul line rises, it indicates that a project is in a cut region and when it descends, it is in a fill region. A mass haul region is marked with balance points and gradient points.
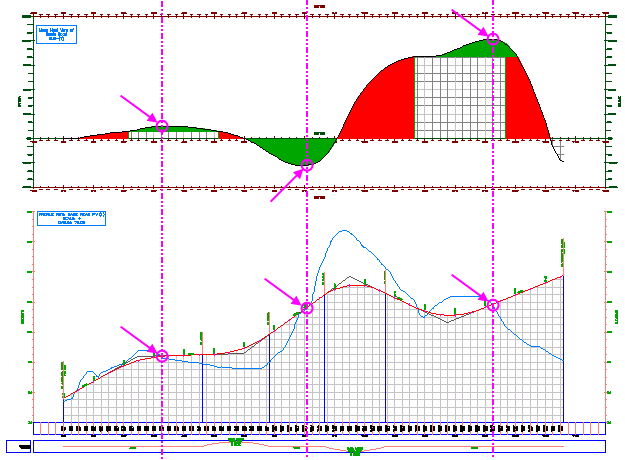
Gradient points (indicated by arrows and circles) in a mass haul diagram (above) and in a profile view connected by lines