Use this dialog box to specify the settings to use when creating an alignment by best fit through a series of objects.
Input Data
- Input Type
-
Specifies the type of source objects (AutoCAD Blocks, AutoCAD Elements, AutoCAD Points, COGO Points, or Feature Lines) from which to create the best fit alignment.
- Weeding Options
-
Opens the Weeding Options dialog box, which enables you to specify options for adding or removing vertices when using either feature lines or AutoCAD elements as the input data.
- Path 1
-
Specifies that the alignment is created through a single path of regression points.
Use this option to create an alignment from centerline sample data.
- Path 2
-
Specifies that the alignment is created between two paths of regression points.
Use this option to create a centerline alignment between sample data of the either the edges of pavement of a road, or the left and right rails.
Best Fit Options
These options affect the manner in which the best fit algorithm is applied to the input data.
- Maximum Radius For Curve Detection
-
Specifies the largest acceptable radius of curves that are created from the input data.
Note: This value is an estimate. For best results, specify a value that is slightly greater than the largest known radius in the input data. - Create Transitions
-
Specifies that transitions are created between the alignment straights and curves. The transitions on either side of a curve are symmetric unless the match straights option is selected.
Note: When this option is selected, the options below it become available. - Desired R/A For Transitions
-
Specifies the target R/A ratio for transitions that are created.
- Create Transitions And Match Straights Where Possible
-
Specifies that the solution will follow the straights as much as possible. If no solution is available, then the straights are moved toward the circles until a transition solution is found between the straight and the curve.
- Minimum R/A For Transitions
-
Specifies the minimum R/A ratio for transitions that are created. This value controls the length of the transitions:
- A higher value produces shorter transitions.
- A lower value produces longer transitions.
Creation Setting
- Alignment Name
-
Specifies the name of the alignment. Each alignment must have a unique name.
- Site
-
Specifies a site for the alignment. Select a site from the Site list, or enter a new site name.
Note: The default selection is <None>, which places the alignment in the top-level Alignments collection in Prospector. See About Alignment and Site Interaction for more information. - Alignment Style
-
Displays the current style. Click the arrow to select another alignment style.
- Alignment Label Set
-
Displays the default alignment label set. Click the arrow to select another alignment label set.
- Layer
-
Displays the layer on which the alignment object is created. Click the arrow to select another layer.
- Transition Type
-
Specifies the transition type to use in the best fit alignment. For more information, see About Transition Definitions.
Note: The Sine Half-Wave Diminishing Straight and NSW Cubic Parabola are not supported for best fit alignments.
- Show Report
-
Opens the Best Fit Alignment Report vista, which lists the results of the best fit regression, including the coordinates of each regression point.
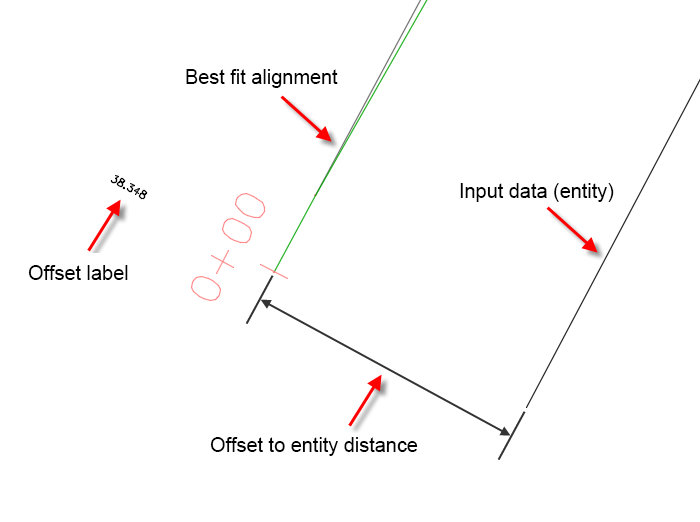
- Label Offsets
-
Creates labels in the drawing that show the Offset to Entity information that is displayed in the Best Fit Alignment Report vista.
The labels show the positive or negative horizontal offset distance from the best fit alignment to the input data (entities). A positive value indicates that the input data is on the right of the best fit alignment (when starting at chainage 0+00) and a negative value indicates that the input data is on the left of the best fit alignment.
 Note: These labels use the Standard text style at a height of 1.00, and they're created on layer 0.