 Curve Curvature
Adds a locator that shows the curvature or radius comb of a curve.
Access this tool from the Locators palette:
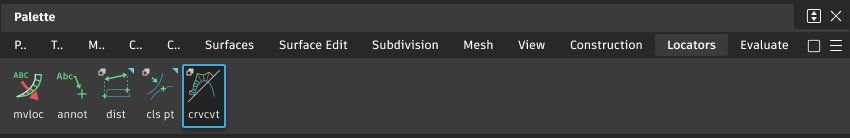
Curve Curvature Options
Plot Value
Curvature – The quill lengths indicate the curvature at that point on the curve (default).
Radius – The quill lengths indicate the radius at that point on the curve. Shift-clicking anywhere along the curve displays a callout with the curve radius value at that point. Shift-click the radius callout to delete it.
Radius can be displayed this way regardless of the Plot Value option you have selected.
Unit Normal – The quill length is constant, so the quills only indicate the direction of the normal at that point on the curve.
Surface Relative
Display the curvature quills, for surface curves, in the direction of the surface normals.
This option has no effect on free curves.
Auto Scale
If this option is checked, the scale of the curvature comb is automatically calculated to be proportional to the size of the object.
When this option is unchecked, a Scale Value slider appears, allowing you to set the scale of the comb at the time of creation.
Scale Value
The scale applied to the comb quills.
Samples
The initial sampling density per curve. Change this value after creating the comb by dragging the  .
.
Display
Comb – Show the comb quills only.
Outline – Show the comb outline (the line connecting the endpoints of the comb quills) only.
Comb + Outline – Shows both the comb quills and the comb outline.
The comb and outline are drawn in different colors.
Torsion
Show torsion quills on the curve
Inflection Points
Show the inflection points on the curve with small red arrows.
To speed up display, the arrows are only close approximations. To see the true inflection point, look for the point where the comb outline crosses the curve.
Show Radius Limit
Display regions of the curvature locator using different colors based on the radius value and the Min. Radius Limit and Max. Radius Limit values.
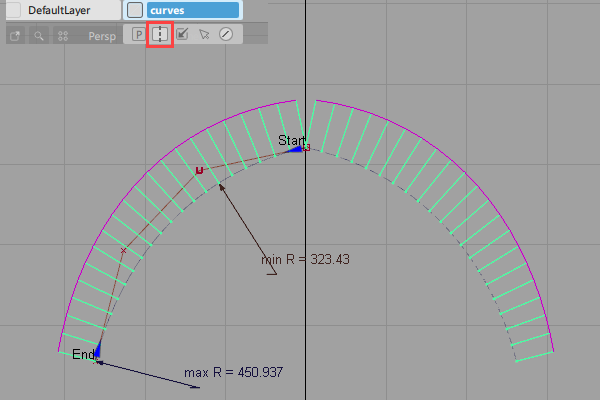
Min Max Radius
Indicates the points of maximum and minimum radius of curvature.
Min. Radius Limit, Max. Radius Limit
Regions of the curvature locator between the Min. Radius Limit and the Max. Radius Limit are drawn in with green quills. Regions of the curvature locator less than the Min. Radius Limit or greater than the Max. Radius Limit are drawn in with rose quills.
These options are only available when ShowRadius Limit is on.
Enable Comb Cutoff
Limits the length of quills by the Cutoff Value.
Cutoff Value
Limit quills to this length.
This option is necessary because some plot values, such as the radius of a straight line, are infinite, or very large.
These options are also found in the Information Window when a Curve Curvature locator is selected. The Information Window has the following additional controls:
Window
Choose whether the annotation appears in all windows or only the current window.
Font Properties
Choose whether the text in the annotation uses a Default or Custom font.
Font Size
Adjust the size of the text when Font Properties is set to Custom.
Modify Range
Modify Range
Turn this on to specify the start and end points of the curvature comb.
This option is helpful when curvature combs overlap, such as when you are adding acceleration. Use it to correct this issue by defining a start and end to the combs so that they does not obscure the display of the curve as you adjustments.
Enter Start and End values or use the in-canvas manipulators set the start and end for the comb.
Curve Curvature workflows
Select the Curve Curvature tool.
Click the curves to which you want to attach a curvature comb. These can be free curves, curves-on-surface, isoparms, or trim edges.
The curvature combs appear on the selected curves.
If the curves are on a layer that has Symmetry turned on, the combs appear on the symmetric geometry as well. If Min Max Radius labels are turned on, they only appear on the original geometry.
Drag the mouse to change properties of the curvature comb:
Drag the
 to change the scale of the quills.
Drag the
to change the sampling density of the comb.Drag the Start and End manipulators to specify a range for the comb start and end points. You can also enter Start and End values under Modify Range.
Note: In orthographic windows, the curve curvature comb displays the curvature of a curve based on the planar projection of the curve that appears in that window. In perspective windows, the curve curvature comb displays the curvature of the 3D curve.
What if...?
I want the comb plots on all the curves to use the same scale?
- Shift-select the Curve Curvature tool.
- Turn off Auto Scale.
- Enter the scale factor in the Scale Value field.
The comb plot doesn’t update as I move CVs?
Choose Preferences > Performance Options. In the Expression Updates section, turn on During Transform.
I need to change the curvature of a curve?
There are many ways you can modify a curve when you are trying to fix curvature problems:
- Move CVs.
- When you move a CV toward the curve along the normal, curvature is reduced near the CV.
- When you move a CV away from the curve along the normal, curvature is increased.
- When you move a CV along the curve, curvature is decreased behind the CV and increased ahead of the CV.
- Use curve editing tools such as Object editor, Stretch, Project tangent, and Align.
I’m looking for a specific range of curvature values?
Choose Windows > Information > Information Window and change the color ranges so that the values you are looking for are drawn in one color.
I want a series of curvature plots across a surface?
Create cross sections on the surface, and turn on the curvatureplot,through the Cross Section Editor. (See Create or view cross sections for more information.)
I want to see a plot of the radius values instead of curvature?
Do either of the following:
- In the Curve Curvature control window, turn on Radius under Plot Value.
- Choose Windows > Information Window and use the Plot Value option to change what the comb plot measures.
About Curvature
Curvature is a measure of how much a curve curves.
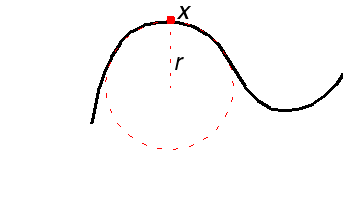
Curvature is measured by fitting a circle into the curve, then taking the reciprocal of the radius of the circle. In the illustration, at point x, the curve is best described by a circle with radius r. At this point, the curvature is 1/r.
(We use the reciprocal, 1/r, instead of just r because a flat line has an infinite radius. Taking the reciprocal gives us 0 instead of infinity.)
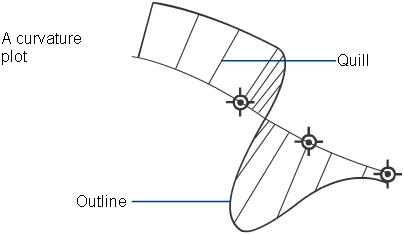
Several tools in Alias, such as the Curve Curvature tool tool, allow you to display a comb plot of a curve’s curvature. At regular points along the curve, the tool samples the curvature, and draws a line (sometimes called a “quill” because it looks like a spine on the back of a porcupine). The length of the line represents the curvature value at that point.
About finding curve problems using the curvature comb
Find inflection points
Turn on the Inflection Points option in the Information window. Inflection points are marked approximately with blue arrows. To find the exact inflection point, zoom in to the point where the comb outline crosses the curve.
What are inflection points?
Inflection points, also called ogees, are the points on the curve where the curvature changes direction.
Measure torsion
Turn on the Torsion option in the Information window to plot secondary quills showing the torsion.
What is torsion?
Torsion is the amount the curve bends out of the plane of curvature.
Find tangent discontinuities
Tangent discontinuities appear as two separate Unit Normal quills originating from the same point on the curve but pointing in different directions.
The telltale quills are always at an edit point. To see them clearly, set the Plot value option to Unit Normal in the Information window, and increase the Samples density to have at least 2 samples per span.
Make sure the Scale is high enough to tell whether there is more than one quill.
What are tangent discontinuities?
Tangent discontinues occur when two curves are not properly aligned. It can also happen at a multi-knot, or because of CV multiplicity.
Find curvature discontinuities
Curvature discontinuities appear as sudden steps in the outline of the curvature comb. You will need to use a high sampling rate to detect curvature discontinuities.
What are curvature discontinuities?
Curvature discontinuities between curves occur when two curves do not have the same curvature at their end, or because of multiplicity. The curve join may be smooth, but the curvature values do not change smoothly.