Specifies device and media settings, and plots your drawing.
PLOT (Command) Find
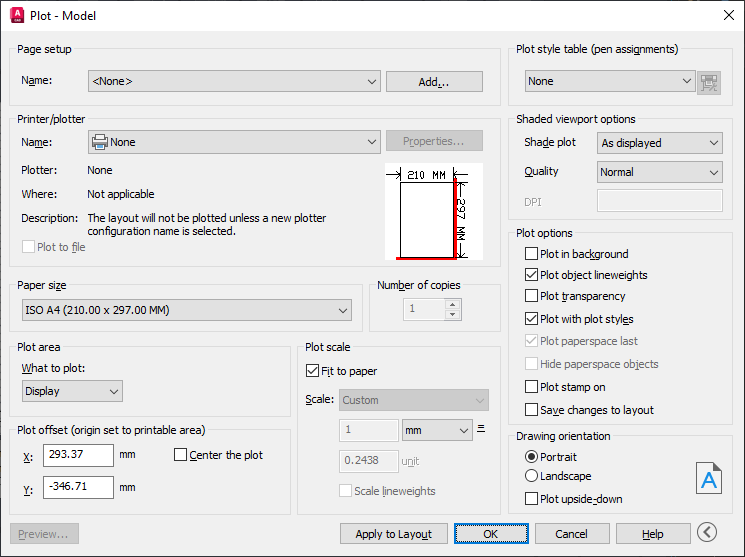
You can display more options by clicking the More Options button.
![]()
List of Options
The following options are displayed.
Page Setup
Displays a list of any named and saved page setups in the drawing. You can base the current page setup on a named page setup saved in the drawing, or you can create a new named page setup based on the current settings in the Plot dialog box by clicking Add.
- Name
-
Displays the name of the current page setup.
- Add
-
Displays the Add Page Setup dialog box, in which you can save the current settings in the Plot dialog box to a named page setup. You can modify this page setup through the Page Setup Manager.
Printer/Plotter
Specifies a configured plotting device to use when plotting layouts.
If the selected plotter doesn't support the layout's selected paper size, a warning is displayed and you can select the plotter's default paper size or a custom paper size.
- Name
-
Lists the available PC3 files or system printers from which you can select to plot the current layout. An icon in front of the device name identifies it as a PC3 file or a system printer.
-
PC3 file icon. Indicates a PC3 file.

-
System printer icon. Indicates a system printer.

-
PC3 file icon. Indicates a PC3 file.
- Properties
-
Displays the Plotter Configuration Editor (PC3 editor), in which you can view or modify the current plotter configuration, ports, device, and media settings.
If you make changes to the PC3 file using the Plotter Configuration Editor, the Changes to a Printer Configuration File dialog box is displayed.
- Plotter
-
Displays the plot device specified in the currently selected page setup.
- Where
-
Displays the physical location of the output device specified in the currently selected page setup.
- Description
-
Displays descriptive text about the output device specified in the currently selected page setup. You can edit this text in the Plotter Configuration Editor.
- Plot to File
-
Plots output to a file rather than to a plotter or printer. The default location for plot files is specified in the Options dialog box, Plot and Publish tab, under Default Location for Plot-to-File Operations.
If the Plot to File option is turned on, when you click OK in the Plot dialog box, the Plot to File dialog box (a standard file navigation dialog box) is displayed.
- PDF Options
- Displays the PDF Options dialog box, which gives you the ability to optimize a PDF file for the specific purpose you are creating it. This button is visible only if you choose a plotter configuration (PC3) file that generates a PDF file.
- Partial Preview
-
Shows an accurate representation of the effective plot area relative to the paper size and printable area. The tooltip displays the paper size and printable area.

Paper Size
Displays standard paper sizes that are available for the selected plotting device. If no plotter is selected, the full standard paper size list is displayed and available for selection.
If the selected plotter doesn't support the layout's selected paper size, a warning is displayed, and you can select the plotter's default paper size or a custom paper size.
A default paper size is set for the plotting device when you create a PC3 file with the Add-a-Plotter wizard. The paper size that you select in the Page Setup dialog box is saved with the layout and overrides the PC3 file settings.
The actual printable area of the page, which is determined by the selected plotting device and paper size, is indicated in the layout by a dashed line.
If you are plotting a raster image, such as a BMP or TIFF file, the size of the plot is specified in pixels, not in inches or millimeters.
Number of Copies
Specifies the number of copies to plot. This option is not available when you plot to file.
Plot Area
Specifies the portion of the drawing to be plotted. Under What to Plot, you can select an area of the drawing to be plotted.
- Layout/Limits
-
When plotting a layout, plots everything within the printable area of the specified paper size, with the origin calculated from 0,0 in the layout.
When plotting from the Model tab, plots the entire drawing area that is defined by the grid limits. If the current viewport does not display a plan view, this option has the same effect as the Extents option.
- Extents
-
Plots the portion of the current space of the drawing that contains objects. All geometry in the current space is plotted. The drawing may be regenerated to recalculate the extents before plotting.
- Display
-
Plots the view in the current viewport in the selected Model tab or the current paper space view in the layout.
- View
-
Plots a view that was previously saved with the VIEW command. You can select a named view from the list. If there are no saved views in the drawing, this option is unavailable.
When the View option is selected, a View list is displayed that lists the named views that are saved in the current drawing. You can select a view from this list to plot.
- Window
-
Plots any portion of the drawing that you specify. When you select Window, the Window button becomes available. Click the Window button to use the pointing device to specify the two corners of the area to be plotted, or enter coordinate values.
Plot Offset
Specifies an offset of the plot area relative to the lower-left corner of the printable area or to the edge of the paper, depending on the setting made in the Specify Plot Offset Relative To option (Options dialog box, Plot and Publish tab). The Plot Offset area of the Plot dialog box displays the specified plot offset option in parentheses.
The printable area of a drawing sheet is defined by the selected output device and is represented by a dashed line in a layout. When you change to another output device, the printable area may change.
You can offset the geometry on the paper by entering a positive or negative value in the X and Y offset boxes. The plotter unit values are in inches or millimeters on the paper.
- Center the Plot
-
Automatically calculates the X and Y offset values to center the plot on the paper. This option is not available when Plot Area is set to Layout.
- X
-
Specifies the plot origin in the X direction relative to the setting of the Plot Offset Definition option.
- Y
-
Specifies the plot origin in the Y direction relative to the setting of the Plot Offset Definition option.
Plot Scale
Controls the relative size of drawing units to plotted units. The default scale setting is 1:1 when plotting a layout. The default setting is Fit to Paper when plotting from the Model tab.
- Fit to Paper
-
Scales the plot to fit within the selected paper size and displays the custom scale factor in the Scale, Inch =, and Units boxes.
- Scale
-
Defines the exact scale for the plot. Custom defines a user-defined scale. You can create a custom scale by entering the number of inches (or millimeters) equal to the number of drawing units.
- Inch(es) =/mm =/Pixel(s) =
-
Specifies the number of inches, millimeters, or pixels equal to the specified number of units.
- Inch/mm/pixel
-
Specifies inches or mm for display of units in the Plot dialog box. The default is based on the paper size and changes each time a new paper size is selected. Pixel is available only when a raster output is selected.
- Units
-
Specifies the number of units equal to the specified number of inches, millimeters, or pixels.
- Scale Lineweights
-
Scales lineweights in proportion to the plot scale. Lineweights normally specify the linewidth of plotted objects and are plotted with the linewidth size regardless of the plot scale.
Preview
Displays the drawing as it will appear when plotted by starting the PREVIEW command. To exit the preview and return to the Plot dialog box, press ESC, press ENTER, or right-click and then click Exit on the shortcut menu.
Apply to Layout
Saves the current Plot dialog box settings to the current layout.
More Options
Controls display of additional options in the Plot dialog box.
- Plot Style Table (Pen Assignments)
- Shaded Viewport Options
- Plot Options
- Drawing Orientation
Plot Style Table (Pen Assignments)
Sets the plot style table, edits the plot style table, or creates a new plot style table.
- Name (Unlabeled)
-
Displays the plot style table that is assigned to the current Model tab or layout tab and provides a list of the currently available plot style tables.
If you select New, the Add Plot Style Table wizard is displayed, which you can use to create a new plot style table. The wizard that is displayed is determined by whether the current drawing is in color-dependent or named mode.
- Edit
-
Displays the Plot Style Table Editor, in which you can view or modify plot styles for the currently assigned plot style table.

Shaded Viewport Options
Specifies how shaded and rendered viewports are plotted and determines their resolution level and dots per inch (dpi). Rendered viewport options are not available in AutoCAD LT.
- Shade Plot
-
Specifies how views are plotted. To specify this setting for a viewport on a layout tab, select the viewport and then, on the Tools menu, click Properties.
From the Model tab, you can select from the following options:
- As Displayed. Plots objects the way they are displayed on the screen. (Available in AutoCAD LT)
- Legacy Wireframe. Objects in wireframe regardless of the way they are displayed on the screen, using the legacy SHADEMODE command. (Available in AutoCAD LT)
- Legacy Hidden. Objects with hidden lines removed regardless of the way the objects are displayed on the screen, using the legacy SHADEMODE command. (Available in AutoCAD LT)
- Conceptual. Plots objects with the Conceptual visual style applied regardless of the way the objects are displayed on the screen.
- Hidden. Plots objects with hidden lines removed regardless of the way the objects are displayed on the screen.
- Realistic. Plots objects with the Realistic visual style applied regardless of the way the objects are displayed on the screen.
- Shaded. Plots objects with Shaded visual style applied regardless of the way the objects are displayed on the screen
- Shaded with Edges. Plots objects with Shaded with Edges visual style applied regardless of the way the objects are displayed on the screen
- Shades of Gray. Plots objects with Shades of Gray visual style applied regardless of the way the objects are displayed on the screen.
- Sketchy. Plots objects with Sketchy visual style applied regardless of the way the objects are displayed on the screen.
- Wireframe. Plots objects in wireframe regardless of the way they are displayed on the screen.
- X-ray. Plots objects with x-ray visual style applied regardless of the way the objects are displayed on the screen
- Rendered. Plots objects as rendered regardless of the way they are displayed on the screen.
- Quality
-
Specifies the resolution at which shaded and rendered viewports are plotted.
You can select from the following resolution options:
- Draft. Sets rendered and shaded model space views to be plotted as wireframe.
- Preview. Sets rendered and shaded model space views to be plotted at one quarter of the current device resolution, to a maximum of 150 dpi.
- Normal. Sets rendered and shaded model space views to be plotted at one half of the current device resolution, to a maximum of 300 dpi.
- Presentation. Sets rendered and shaded model space views to be plotted at the current device resolution, to a maximum of 600 dpi.
- Maximum. Sets rendered and shaded model space views to be plotted at the current device resolution with no maximum.
- Custom. Sets rendered and shaded model space views to be plotted at the resolution setting that you specify in the DPI box, up to the current device resolution.
- DPI
-
Specifies the dots per inch for shaded and rendered views, up to the maximum resolution of the current plotting device. This option is available if you select Custom in the Quality box.
Plot Options
Specifies options for lineweights, transparency, plot styles, shaded plots, and the order in which objects are plotted.
- Plot in Background
-
Specifies that the plot is processed in the background. (BACKGROUNDPLOT system variable)
- Plot Object Lineweights
-
Specifies whether lineweights assigned to objects and layers are plotted.
- Plot Transparency
-
Specifies whether object transparency is plotted. This option should only be used when plotting drawings with transparent objects.
Attention: For performance reasons, plotting transparency is disabled by default. To plot transparent objects, select the Plot Transparency option. This setting can be overridden by the PLOTTRANSPARENCYOVERRIDE system variable. By default, the system variable honors the setting in the Page Setup and the Plot dialog boxes. - Plot with Plot Styles
-
Specifies whether plot styles applied to objects and layers are plotted.
- Plot Paperspace Last
-
Plots model space geometry first. Paper space geometry is usually plotted before model space geometry.
- Hide Paperspace Objects
-
Specifies whether the HIDE operation applies to objects in the paper space viewport. This option is available only from a layout tab. The effect of this setting is reflected in the plot preview, but not in the layout.
- Plot Stamp On
-
Turns on plot stamping. Places a plot stamp on a specified corner of each drawing and/or logs it to a file.
Plot stamp settings are specified in the Plot Stamp dialog box, in which you can specify the information that you want applied to the plot stamp, such as drawing name, date and time, plot scale, and so on. To open the Plot Stamp dialog box, select the Plot Stamp On option, and then click the Plot Stamp Settings button that is displayed to the right of the option. You can also open the Plot Stamp dialog box by clicking the Plot Stamp Settings button on the Plot and Publish tab of the Options dialog box.
Note: Drawings created with an Autodesk product labeled Student Version in the title bar of the application window automatically use a plot stamp that reads, "PRODUCED BY AN AUTODESK STUDENT VERSION". The STUDENTDRAWING system variable reports whether the current drawing was created with an Autodesk Student Version product. - Plot Stamp Settings button
-
Displays the Plot Stamp dialog box when the Plot Stamp On option is selected in the Plot dialog box.

- Save Changes to Layout
-
Saves changes that you make in the Plot dialog box to the layout.
Drawing Orientation
Specifies the orientation of the drawing on the paper for plotters that support landscape or portrait orientation. The paper icon represents the media orientation of the selected paper. The letter icon represents the orientation of the drawing on the page.
- Portrait
-
Orients and plots the drawing so that the short edge of the paper represents the top of the page.
- Landscape
-
Orients and plots the drawing so that the long edge of the paper represents the top of the page.
- Plot Upside-Down
-
Orients and plots the drawing upside down.
- Icon
-
Indicates the media orientation of the selected paper and represents the orientation of the drawing on the page as a letter on the paper.
Less Options
Hides the following options in the Plot dialog box:
- Plot Style Table (Pen Assignments)
- Shaded Viewport Options
- Plot Options
- Drawing Orientation