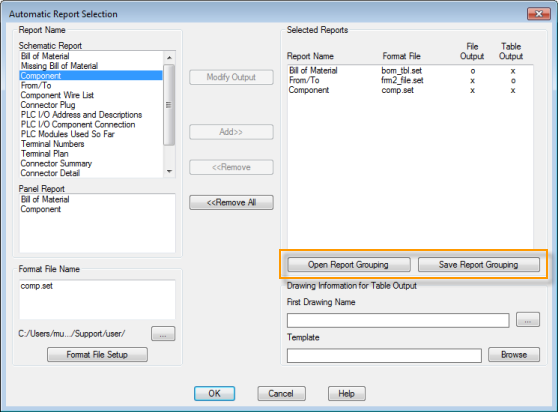
The Automatic Reports tool allows you to run multiple reports at one time. You can save each report to a file, place each report as a table, or both. Find
The Report Generator dialog box is not displayed for each report and no user input is required once launched. Format files are required to use Automatic Reports. The format files must define file output, table output, or both since the reports are not displayed on the screen. Use Format File Setup to define file and table output in a format file. Find
If you frequently run the same group of reports you can save the group as a report grouping. To set up a report grouping, add all your format files as if you are going to run the reports and save the report grouping. The information about the format files is saved in a Report Grouping file with an .rgf extension. The next time you want to run that group of reports, open the .rgf saved previously.

Table Output
If any of your selected format files contain table output, the program checks for any existing tables for the selected report. If an existing table meets all of the following conditions it is considered a match to the current report and updates.
- The existing table is for the same report, for example Schematic Bill of Material; Normal Tallied Format.
- The existing table is for the same scope, for example Active Drawing or Project.
- The existing table used the same format file. If the table was inserted without specifying a format file, it is a match if you do not use a format file for the report you are running.
If no matching tables are found, the report tables insert on new drawings. If you are running multiple reports with multiple table output, each report inserts new tables on its own drawings. You can specify the first drawing name and the template name for any new drawings. Subsequent drawing names generate automatically by incrementing the previous drawing's name.
Define the insertion point in the format file, otherwise the table is inserted at 0,0 coordinate value by Automatic Reports.

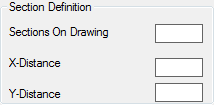
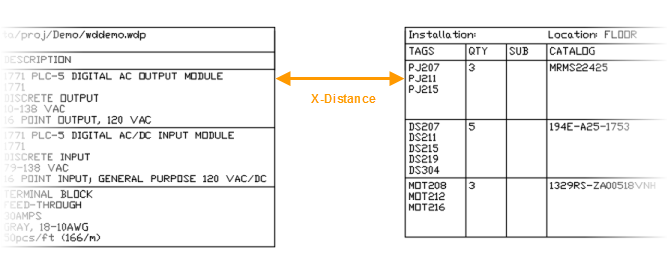
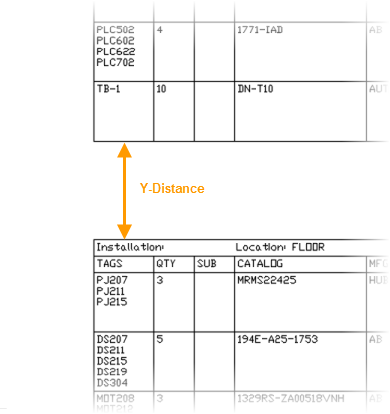
Breaks in a report table can be defined either by using the Special Breaks option or by defining a specific number of rows per table section. If your table contains breaks and multiple table sections per drawing, define the distance between table sections in your format file.

The X-distance and Y-distance values define the distance from the end of one table section to the beginning of the next. It is used when multiple table sections for one report are on the same drawing. A blank value is interpreted as zero.

