You can insert tables into a drawing to document the geometry of selected objects.
Each row in a table contains information about a single object component, such as a line. Tables are supported for points, parcels, alignments, surfaces, pipes, and structures.
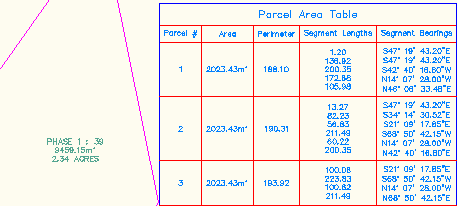
- The first column of data in a table is reserved for the tag number or identifier. Note: For point tables, the point number is used as the identifier. For parcel tables, the parcel ID is used as the identifier for the area and tag numbers are used for lines and curves.
- Additional columns display the object data.
Adding Tables
Add a table to a drawing by doing the following:
- Set up a table style for the object. The table style specifies the type of data that is inserted into the table.
- Label the objects whose data you want to add to a table.
Select table data by using the following methods:
- By selecting individual labels
- By specifying a label style
- By selecting point groups (for point tables)
- By selecting an alignment (for alignment segment tables)
When you insert a table into a drawing, most labels are required to be displayed in tag mode (the exceptions to this rule are parcel area tables and point tables).
If the labels are currently set to label mode, they are automatically switched to tag mode when you insert the table. Although it is not required, you may prefer to set the label styles to tag mode before inserting a table to avoid the creation of unwanted styles.
After creating tags, you can renumber them to reset their sequential order.
Adding Surface Legend Tables
When you perform a surface analysis, the data is separated into ranges that are assigned different colors. Legend tables display these colors and range values.
Add a surface legend table to a drawing, by doing the following:
- Perform a surface analysis. For more information, see Analysis Tab (Surface Properties Dialog Box).
- Modify the surface style so that it displays the analysis type. For more information, see Display Tab (Surface Style Dialog Box).
- Set up a surface legend table style to display the surface data.