Detection of Global Structural Failure
Examine the relationship between global structural force and global structural deformation.
In the previous section, we used color contour plots to examine the distribution of the discrete composite failure state (SVAR1) within a composite structure. In viewing these contour plots, we can appreciate that each of the damaged regions represents material whose stiffness has been significantly degraded. Furthermore, by examining the changes that occur in these contour plots over time, we can clearly see the cascade of localized material failure that occurs during a progressive failure analysis. However, viewing the distribution of material failure does not provide any indication of the overall impact of the material failure on the global stiffness of the structure. Moreover, it is impossible to detect global structural failure by simply examining the distribution of material failure over the structure.
In order to detect global structural failure or to associate a particular distribution of damage with a decrease in overall structural stiffness, we must first examine the relationship between global structural force and global structural deformation. This type of relationship is best examined using a simple 2-D plot of force vs. deformation. However, the key issue is to select an appropriate measure of global structural force and an appropriate measure of global structural deformation.
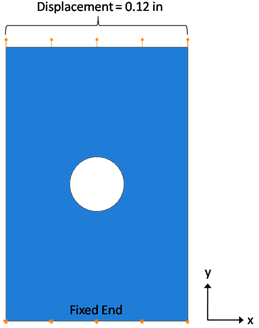
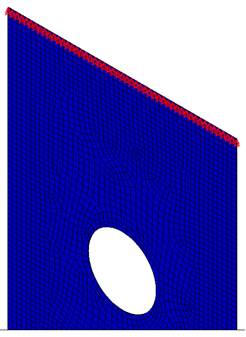
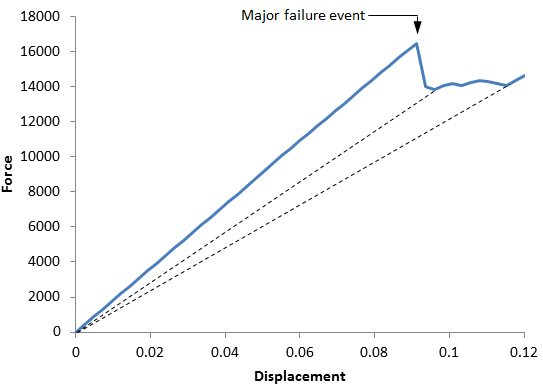
As an example, let us consider an 8-ply composite plate shown below. Note that this is the same composite plate problem examined earlier. As seen in the previous section, the distribution of damage within layer 3 of the composite plate is shown at several different points in time over the course of the analysis. However, simply viewing the contour plots does not provide us with an understanding of how each of the damage distributions affects the global structural stiffness of the composite plate. To understand the degradation of global structural stiffness as localized failures spread throughout the composite plate, let us examine a simple 2-D plot of global structural force vs. global structural deformation. Since this composite plate is subjected to a uniform axial displacement imposed along the top edge of the plate, the imposed axial displacement will serve as an appropriate measure of the overall structural deformation in the plate. Similarly, the total axial reaction force along the top edge of the plate will serve as an appropriate measure of global structural force in the plate. This total reaction force is obtained by summing the nodal reaction forces for all nodes on the top edge of the plate (see the second image below). The third image below shows a plot of global structural force vs. global structural deformation for the composite plate.


Beginning at an imposed displacement of 0.0912, the overall secant stiffness of the structure starts to deteriorate rapidly. Beyond this point, as the imposed axial displacement is further increased, the structure is unable to resist with additional structural force.
Examination of the load-displacement plot reveals that the global force/displacement response of the composite structure appears to remain linear until the imposed displacement reaches a value of approximately 0.0912. If we examine the contour plots in the previous section, we see that by the time the imposed axial displacement has reached the value of 0.084, the composite plate has accumulated a significant amount of matrix constituent failure along the vertical edges of the circular hole. However, this amount of matrix constituent failure is insufficient to make a visually detectable impact on the global stiffness of the composite plate.
As the imposed displacement is increased from 0.084 to approximately 0.096, the global stiffness of the composite plate undergoes a drastic reduction, (as shown in the load-displacement plot) indicting a significant cascading of localized fiber constituent failures (i.e., a major failure event has occurred). In examining the contour plots, we see that at an imposed displacement of 0.096, the composite plate has experienced a significant amount of fiber constituent failure along the vertical edges of the circular hole. As the imposed displacement is increased beyond 0.096, the composite plate no longer responds to increasing displacement with increasing structural force. Instead, the overall structural force in the composite plate remains relatively constant, indicating that the spread of localized failures is too rapid to build any additional structural force. However, as seen by the two dotted lines in the plot above, the overall secant stiffness of the composite plate continues to decrease despite the fact that the overall structural force remains relatively constant.
There are many possible ways to define global structural failure. The exact point that signals global structural failure depends upon the intended use of the composite plate. The point that should be emphasized here is that the detection of global structural failure requires an examination of the global structural force vs. global structural deformation.
In summary, contour plots of the MCT state variables (especially SVAR1) provide you with a clear picture of the extent of localized failures at any particular point in time. In order to correlate any of the damage distributions with decreased overall stiffness of the composite structure, you must examine plots of global structural force vs. global structural deformation. In this way, you can associate observed changes in the global stiffness of the structure with specific damage distributions.