Remove the filtered parcel layer and connect to both the original and filtered parcels as separate layers.
This exercise uses the AnalyzeMap1.dwg map you created and modified in the previous exercises.
To compare the two parcel layers
- In Display Manager, right-click the Parcels layer and click Remove Layer.
-
Click
 .
.
- In the Data Connect window, connect to the SDF file you created, which contains only the parcels that lie within the construction zone. Add this data to your map.
Leave the Data Connect window open, but move it to one side so you can see the Task pane.
- In Display Manager, select the new Parcels layer, and then click its name. Enter a new name, for example, ConstructionParcels.
- In the Data Connect window, connect to the file that contains the original set of parcels. Add this data to your map and close the Data Connect window.
The new layer is called Parcels in the Display Manager.
Compare the layers using styles
You can style the two layers differently and use transparency to see how they compare.
You can also use Overlay to compare layers. For an example of Overlay, see Lesson 4: Performing a Flood Analysis (the following lesson).
Compare the two layers using styles
- In Display Manager, right-click the original parcels layer (Parcels) and click Edit Style.
- In the Style Editor, set the fill element for this parcel layer to be fairly transparent (75) and a light green color. Leave the Style Editor open.
- Click the construction-zone parcel layer (ConstructionParcels).
- In the Style Editor, set this parcel layer to be opaque (transparency set to 255) and a medium brown color. Close the Style Editor.
- In Display Manager, redisplay the surface raster image by selecting its box and the box for the contour layer.
- In Display Manager, clear the check box for the buffer layer.
- In Display Manager, click Draw Order.
- Make sure the draw order looks like the illustration:
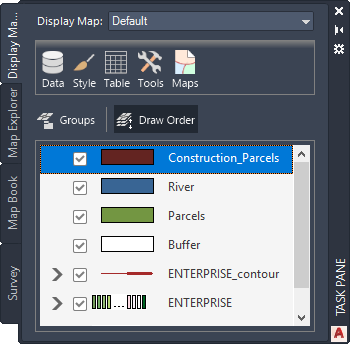
Click Draw Order to change how layers overlay each other.
Where you are now
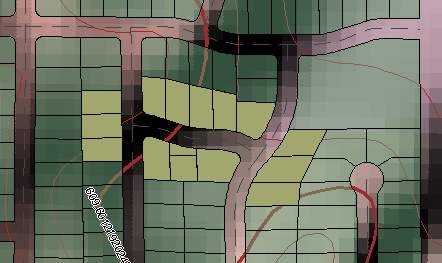
Your map now displays the raster image, overlaid with the roads, the original parcel layer, and the construction-zone parcels.
To continue this tutorial, go to Exercise 5: Export the data to CSV for use in a report.