Display normalized curves
To normalize your animation curves
- Select the animated objects whose curves you want to normalize.
- Open the
Graph Editor.
The Graph Editor appears with all the animation curves for the selected objects displayed in the graph view.
- Do one of the following:
- In the Graph Editor menu bar, select .
- In the
Graph Editor tool bar, click the
Enable Normalized Curve Display
icon (
 ).
).
All the curves currently displayed in the Graph Editor’s graph view are scaled to fit within a range of -1 to 1. Only the displayed curves are scaled, not the underlying animation.
To turn off normalized curve display
- Select the animated objects whose curves you want to revert back to their non-normalized states.
- Open the
Graph Editor.
The Graph Editor appears with all the animation curves for the selected objects displayed in the curve view.
- In the Graph Editor Outliner, select the channels for which you want to turn off normalized display.
- Do one of the following:
- In the Graph Editor menu bar, select .
- In the
Graph Editor tool bar, click the
Disable Normalized Curve Display icon (
 ).
).
The curves in the Graph Editor graph view return to their original display.
To renormalize curves
- Select the animated objects whose curves you want to re-normalize.
- In the Graph Editor Outliner, select the channels for which you want to re-normalize curves.
- Do one of the following:
- In the Graph Editor menu bar, select .
- In the
Graph Editor tool bar, click the
Renormalize curves icon (
 ).
).
All the selected curves currently displayed in the Graph Editor’s graph view are scaled to fit within a range of -1 to 1. Only the displayed curves are scaled, not the underlying animation.
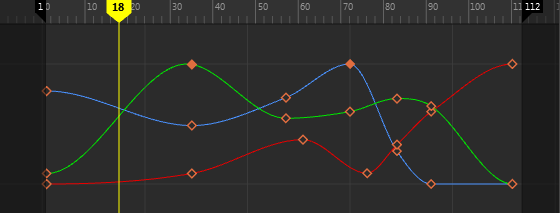
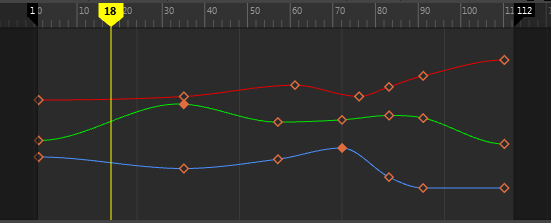
Display stacked curves
By default, curves are displayed overlapping in the graph view. You can switch to view a stack of individual curves.
Customize the individual curve colors of the Graph Editor in the Color Settings.) You can also modify the horizontal lane width in the Stacked view spacing setting in the Animation (Setting) preferences.
When using the Scale Keys Tool or the Lattice Deformer Keys Tool with Stacked Curves turned on, you can only modify the time value.
To turn off stacked display of curves
From the Graph Editor menu bar, select again.
You can also toggle Stacked curves on and off quickly using the
Enable Stacked View
![]() and
Disable Stacked View
and
Disable Stacked View
![]() icons in the
Graph Editor toolbar.
icons in the
Graph Editor toolbar.
Display directly connected curves only
You can limit which curves display in the graph view for a selected channel.
To have only directly connected curves display in the graph view
- In the Graph Editor Outliner, select the channels whose curve display you want to limit.
- From the Graph Editor menu bar, turn off the option.
To have all curves display again for the selected channel
- Turn on in the Graph Editor menu bar.
Show affected areas of a curve
You can set the Graph Editor to display the parts of a curve that is affected by a selected key or tangent. This is useful when you are trying to measure the influence a key has on the preceding or following animation.
- In the Graph Editor View menu, turn on Highlight Affected Curves, then:
-
- Select a key: the affected curve highlights each side of the key
- Select multiple keys: the entire range of the curve affected by the selection is highlighted
- Select a tangent: the segment of the curve affected by the selected tangent (on the selected side) is highlighted
- Select multiple tangents: highlights only parts affected by the selected tangents