The MEL Profiler is a profiling system that monitors tool usage and records the metrics needed to identify bottlenecks. Additionally, the profiling data can be used for rapid and easy diagnosis of MEL toolsets. 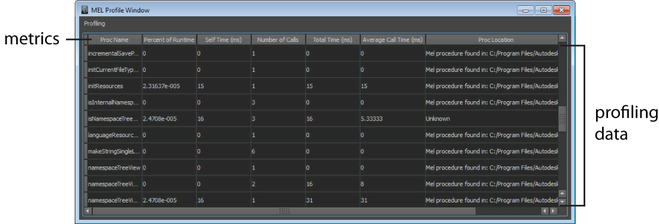
Metrics
- Proc Name
- The procedure name.
- Percent of Runtime
- The percentage of total run-time for the procedure based on the time span of profiling (Self Time).
- Self Time (ms)
- The total amount of time (in milliseconds) the procedure took to execute, excluding the time its child procedures incurred.
- Number of calls
- The number of times the procedure is called.
- Total Time (ms)
- The total amount of time (in milliseconds) spent in the procedure over its various invocations. Note: This value includes the time incurred by the procedure's child procedures.
- Average Call Time (ms)
- The average amount of time (in milliseconds) spent in the procedure per invocation.
- Proc Location
- The location of the procedure if it is known. All local procedures are listed as Unknown.