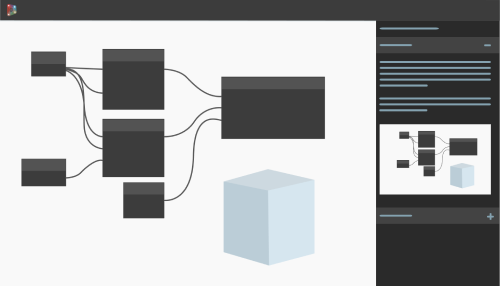
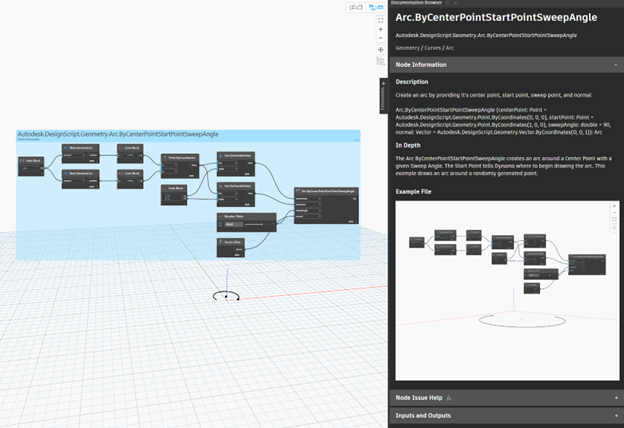
With the Dynamo Documentation Browser, you can learn more about specific nodes and insert sample graphs into your workspace.

What is it?
With Dynamo for Revit, you can extend building information modeling with visual programming, allowing you to automate time-consuming manual workflows. Dynamo offers a vast library of nodes for a wide range of functions. To help understand and use these nodes, the Documentation Browser provides extended guidance and examples without disrupting your graph-building workflow.
The Dynamo Documentation Browser is a panel in the Dynamo interface where you can find information about various Dynamo topics, including several settings, features, and nodes. It provides guidance within Dynamo so that you don’t need to navigate to an external browser to learn more. The Documentation Browser is a great tool for both beginners and more advanced Dynamo users to help problem-solve and make more informed node selections.

Why should I use it?
The Documentation Browser is a useful tool for graph building. If you encounter a new or unfamiliar node, the Documentation Browser may provide an explanation of how the node works, along with an interactive example of the node used in graph context. This helps you choose the right node and understand what inputs and outputs it requires, in addition to other usage considerations. If an example graph is provided, you can view it within the Documentation Browser or place it into the workspace (Revit 2024.1 and later), which allows you to experiment with the node and include it in your graph.
Not all nodes have in-depth documentation or an example, but new content is being added over time. If you have a request for node documentation and examples that aren’t yet available, let us know on the Dynamo forum, or click Yes at the bottom of this page to display and fill out the feedback form.
How do I access it?
In Revit, launch Dynamo from the Manage tab. To access node help in the Documentation Browser, place a node from the library or through the right-click in-canvas search, then right click on the node and select Help from the menu. The browser panel will open on the right side of the screen. You can resize it or pop it out to a separate window.
When you trigger node help, the Documentation Browser will open information specific to that node. If you’d like to see help for another node, right click that node and select Help. The contents of the Documentation Browser update to describe that node.
Several settings and dialogs in Dynamo are accompanied by question mark icons. Icons that turn blue when you hover over them indicate that there is documentation available. Click the icon to open help content inside the Documentation Browser and learn more about the setting or feature.
How do I use it?
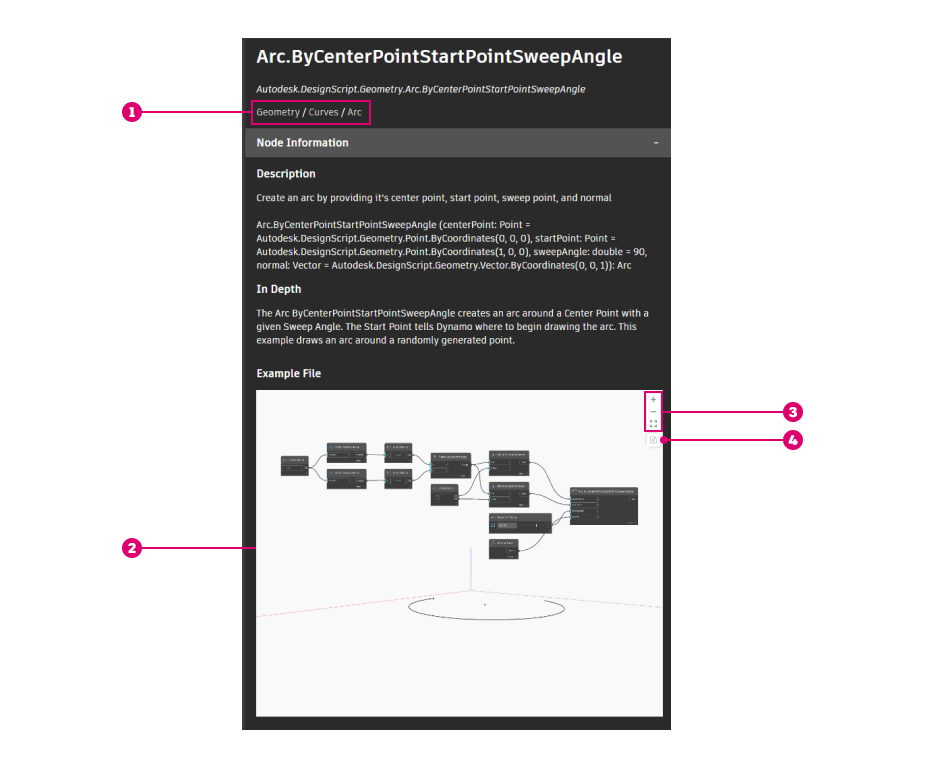
In the Documentation Browser, the node's name is shown at the top of the panel, followed by the node's full name including library information. A breadcrumb trail
 is available below the full name, displaying the node's library path. You can click any of these libraries to open the node library at that location. This can be useful if you are looking for similar nodes.
Node help in the Documentation Browser consists of three sections. You can collapse and expand these sections by clicking on their headers to reduce the amount of content on screen and focus on the information you need.
Node Information
This section includes a short description of the node and, for many nodes, in-depth guidance for using the node.
This section may also include an interactive example file
 . These examples are graphs that contain the node to illustrate its inputs and outputs and how it works. If the example graph generates geometry, a preview is shown in the background of the example image. You can zoom in/out by using your mouse scroll wheel or the control buttons on the image
 . You can also pan by clicking and dragging, or click the Zoom to Fit button, which brings the full graph and geometry preview back into view.
To insert the example into your workspace, click the Add to Workspace button
 . This option is available only in Revit 2024.1 and later. If you are currently on Automatic run mode, it will be changed to Manual to avoid any conflicts with existing workspace content. The example is added as a group below any nodes already on the workspace. From here, you can continue working on the sample like any other graph. You can also re-insert the sample if needed, for example, if you’ve made changes to it and want to refer to the original version.

Node Issue Help
This section only appears if the node is in an error or warning state. It includes the error message and, for some errors and warnings, a more detailed explanation of the issue and how to address it.
Inputs and Outputs
This section shows information about the node’s inputs and outputs in two separate lists, which allows you to examine them in one place without having to hover over each port. For inputs, the list includes the node’s name, type, description, and default value for each input. For outputs, the node’s name, description, and data type are provided. To view the contents of these tables more easily, expand the Documentation Browser window by clicking and dragging its edge.
Try the Documentation Browser to simplify your Dynamo learning and graph-building activities, and share your feedback on the Dynamo forum or by clicking Yes at the bottom of this page to display and fill out the feedback form.