Decision Center > Summary Values
Plot Summary Value data and control the displayed result quantities. Note that the Summary Values panel is visible only when Summary Values are displayed.
Plot Selected Rows
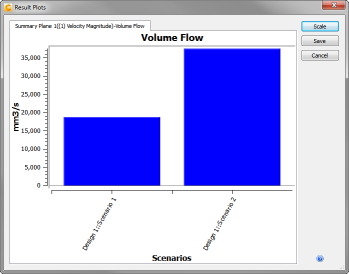
Select a row by clicking on the result quantity in the Summary Value table. To select multiple rows, hold the ctrl key while selecting rows. Use Plot Selected Rows to create a bar-chart of the result quantities for all selected scenarios:

Plot All Rows
Create a plot showing all result quantities listed in the Summary Value table. Each quantity is displayed on a separate tab.
Display Quantities
Control which result quantities are listed in the Summary Value table by selecting or deselecting from the Display Quantities list.