Monitor Points
Monitor points are locations in the model on which the basic degrees of freedom (result quantities) are plotted in the Convergence Plot throughout the analysis. They provide a way to track trends and monitor convergence at specific (critical) locations in the analysis model.
An example using monitor points is an electronic system containing several components. One component in particular is very sensitive, so it is important to know when the temperature on it is fully converged (not changing with additional iterations).
Create a monitor on the component before running the scenario. As the calculation progresses, plot the convergence results (particularly temperature) on the Convergence Plot. As the analysis progresses, the temperature on the component is plotted, and it is easy to track what the temperature is (to ensure the integrity of the design) as well as when it no longer is changing (to help understand when the analysis is converged).
Creating Monitor Points
Create monitor points before running the calculation to ensure that results are plotted for them on the Convergence Plot.
Right click off the model, and click Monitor point....
There are several ways to position a monitor point:
Position it graphically with the Monitor Point Triad.
To position the monitor point with the triad:
Hover over the desired axis of the triad until it highlights.
Press and hold the left mouse button.
Drag the axis in the highlighted direction.
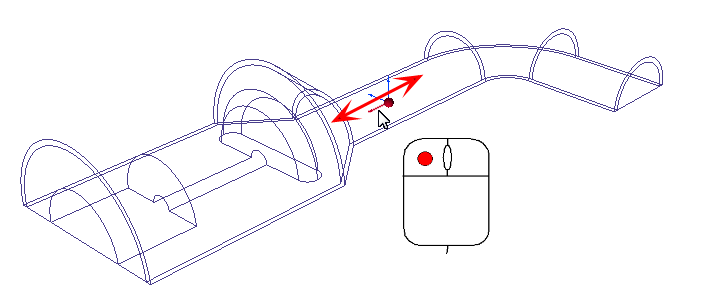 Note: A red sphere at the origin of the Monitor Point triad shows the current location.
Use the X, Y, and Z sliders to position the point on the model.
Key in specific coordinates in the Monitor Point dialog. Click the Show Points button to see the point on the model.
(Optional) Assign a name to the monitor point.
Click the Add button on the Runtime Monitor Points dialog.

It is acceptable to create monitor points after iterations have been completed, and then run additional iterations. The plotted monitor point data on the Convergence Monitor will simply start at this intermediate iteration, instead of at the beginning of the calculation.
If a monitor point is removed and the analysis is continued, then no data for that point will be plotted in the Convergence Plot for subsequent iterations.
When as analysis is started back at iteration 0, all monitor point data from the previous analysis will be deleted (as will all Convergence Plot data).
Select a specific monitor point from the menu on the right side of the Convergence Plot.