Note: Debugging is not available in AutoCAD LT.
- In Visual Studio Code, open and activate an editor window that contains the AutoLISP source code to debug.
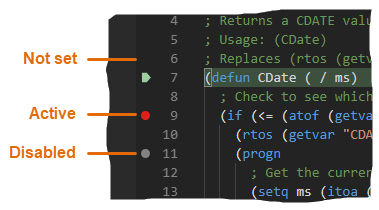
- In the margin of the active editor window, do one of the following:
- Add a breakpoint – Click to the left of a line
- Remove a breakpoint – Click an existing breakpoint
- Disable a breakpoint – Right-click (or secondary click on Mac OS) an existing breakpoint and choose Disable Breakpoint
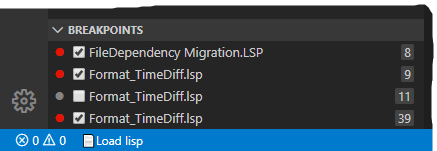
 Tip: You can also use the Breakpoints section on the Debug and Run view to manage active and disabled breakpoints while debugging.
- Click Start Debugging or press F5 to load and debug the AutoLISP source code in the active window.