横断ビューのデータ帯は、AeccBandSectionDataStyle 型のオブジェクトで記述します。このデータ帯内の情報は、主チック マークと副ティック マーク、中心線、各横断勾配変化点、および各横断抽出ライン頂点で表示できます。中心線は、横断抽出ラインが線形と交差する位置です。横断抽出ラインが線形と交差しない場合、中心点は延長した横断抽出ラインが線形と交差する位置です。AeccSampleLines.AddByPolyline メソッドを使用して複数セグメントの横断抽出ラインを作成しなかった場合、横断抽出ラインの各頂点に情報を配置すると、横断の終点にティック マークとラベルが配置されます。
各ラベル スタイルは、次のプロパティ フィールドを使用できます。
| AeccBandLabelStyle 文字コンポーネントで使用できる有効なプロパティ フィールド |
|---|
| <[Distance from Centerline(Uft|P2|RN|Sn|OF|AP)]> |
| <[Distance from Centerline Side(CP)]> |
| <[Offset from Centerline(Uft|P3|RN|AP|Sn|OF)]> |
| <[Offset from Centerline Side(CP)]> |
| <[Section1 Elevation(Uft|P3|RN|AP|Sn|OF)]> |
| <[Section2 Elevation(Uft|P3|RN|AP|Sn|OF)]> |
| <[Section1 Elevation Minus Section2 Elevation(Uft|P3|RN|AP|Sn|OF)]> |
| <[Section2 Elevation Minus Section1 Elevation(Uft|P3|RN|AP|Sn|OF)]> |
| <[Section Segment Grade In(FP|P2|RN|AP|Sn|OF)]> |
| <[Section Segment Grade Out(FP|P2|RN|AP|Sn|OF)]> |
| <[Section Segment Grade Change(FP|P2|RN|AP|Sn|OF)]> |
次の例は、2 つの異なる位置に横断標高データを表示するデータ帯スタイルの作成を示しています。
Dim oBandSectionDataStyle As AeccBandSectionDataStyle
Set oBandSectionDataStyle = oDocument.SectionViewBandStyles. _
  SectionDataBandStyles.Add("Segment Band")


' Display at every major grid line a tick mark and a label
' that shows the section elevation at that point.
With oBandSectionDataStyle
    .MajorOffsetLabelDisplayStylePlan.Color = 255 ' white
    .MajorOffsetLabelDisplayStylePlan.Visible = True
    .MajorOffsetTickDisplayStylePlan.Color = 255 ' white
    .MajorOffsetTickDisplayStylePlan.Visible = True
End With
With oBandSectionDataStyle.MajorIncrementLabelStyle. _
  TextComponents.Item(0)
    .Contents = "<[Section1 Elevation(Um|P3|RN|AP|Sn|OF)]>m"
    .Color = 255 ' white
    .Visibility = True
    ' Shift the label to the high side of the band.
    .YOffset = 0.015
End With


' Display a red tick mark and a red label showing section
' elevation at each vertex endpoint in the sample line.
' Make the tick mark large, and only at the top of the
' band.
With oBandSectionDataStyle
    .SampleLineVertexLabelDisplayStylePlan.Color = 20 ' red
    .SampleLineVertexLabelDisplayStylePlan.Visible = True
    .SampleLineVertexTickDisplayStylePlan.Color = 20 ' red
    .SampleLineVertexTickDisplayStylePlan.Visible = True
End With
With oBandSectionDataStyle.SampleLineVerticesLabelStyle. _
  TextComponents.Item(0)
    .Contents = "<[Section1 Elevation(Um|P3|RN|AP|Sn|OF)]>m"
    .Color = 20 ' red
    .Visibility = True
    .YOffset = 0.08
End With
With oBandSectionDataStyle.SampleLineVerticesLabelStyle. _
  TickStyle
    .IncrementSmallTicksAtTop = True
    .IncrementSmallTicksAtMiddle = False
    .IncrementSmallTicksAtBottom = False
    .SmallTicksAtTopSize = 0.015
End With


' Hide all other data locations in the data band.
With oBandSectionDataStyle
    .CenterLineLabelDisplayStylePlan.Visible = False
    .CenterLineTickDisplayStylePlan.Visible = False
    .GradeBreakLabelDisplayStylePlan.Visible = False
    .GradeBreakTickDisplayStylePlan.Visible = False
    .MinorOffsetLabelDisplayStylePlan.Visible = False
    .MinorOffsetTickDisplayStylePlan = False
End With
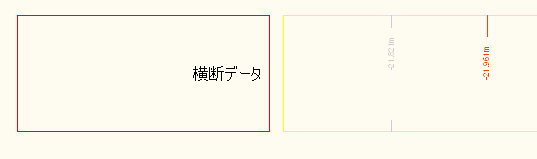
このスタイルは、次のようなデータ帯を生成します。