Understand that the method of determining response spectrum Sa=Sa(T) for a given diagram of accelerations F(t), where T refers to period, Sa refers to acceleration spectrum, t refers to time, while F(t) is a given time analysis function.
This is useful if in comparing the seismic responses obtained with the use of both spectral analysis and time analysis. The curve of response spectrum Sa=Sa(T), that overlaps exactly with the given function F(t) of time analysis (saving the acceleration diagram) should be ascribed.
You can analyze the dynamic structure response using the method of response spectrum (spectral analysis) for the current acceleration diagram. The pseudo-spectral acceleration is the maximum acceleration of a single degree of freedom due to the given diagram of acceleration.
where
Tp - recorded duration of an earthquake, ω = 2π/T - pulsation for Tmin ≤ T ≤ Tmax, ξ- damping parameter (expressed as a percentage of the critical damping), F(t) - given acceleration diagram.
In Figure 1, it is assumed, that the time analysis function F(t) is given. The sequence of Cauchy problems (2) for T = T1 < T2 < … < Tnpoints will be integrated numerically, where

The response spectrum is presented in Figure 2.
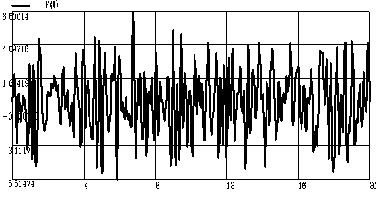
Figure 1

Figure 2