Single element model results
Examine the results from the single element model.
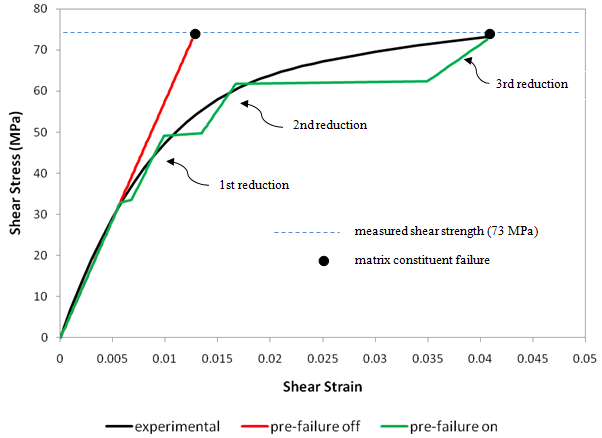
In what follows, three sets of longitudinal composite shear stress/strain (σ12 vs. ε12) data are compared: experimental data [1], data generated from the finite element model with progressive failure on and pre-failure off, and data generated from the finite element model with both progressive failure and pre-failure on. Results from this comparison highlight the effects of using the pre-failure feature in Helius PFA.
The longitudinal composite shear stress vs. strain data is shown below. The black line represents the experimental data, the red line represents the data generated with pre-failure nonlinearity off, and the green line represents the data generated with pre-failure nonlinearity on. With pre-failure turned off, the shear stress in the model increases linearly up to the composite shear strength of 73 MPa, at which point the matrix constituent fails instantly. The deformation matches the experimental deformation to a strain of about 0.006, but quickly diverges as the strain increases beyond 0.006. With pre-failure turned on, the shear stiffness undergoes three discrete reductions prior to failing at 73 MPa. These reductions in the shear stiffness are applied to the matrix constituent and subsequently directly decrease the shear stiffness of the composite. This gradual reduction in the shear stiffness allows the model to deform in a manner much more consistent with the measured data. At failure, for example, the strain with pre-failure off is ≈ 0.013, the strain with pre-failure on is ≈ 0.04, and the experimental strain is 0.04.