Progressive Fatigue Results
Viewing results from a progressive fatigue analysis is very similar to viewing results from a traditional Helius PFA static progressive failure analysis.
The meanings of the solution-dependent state variables are modified for fatigue analyses, and the new meanings are always given in the .mct file accompanying the job that was run. For unidirectional materials, the solution-dependent state variables take the form:
Material state as:
1.0 No damage
2.0 Transverse matrix cracking
3.0 Longitudinal matrix cracking and fiber failure
Number of cycles accompanying the given load increment. This value is always updated unless the fiber has failed, in which case the number of cycles to failure is set to that at fiber failure.
Damage parameter for longitudinal cracking. A value of 0.0 indicates no damage, and a value of 1.0 indicates a longitudinal crack.
Damage parameter for transverse cracking. A value of 0.0 indicates no damage, and a value of 1.0 indicates a transverse crack.
Material temperature for longitudinal cracking. This value is used for hysteresis heating computations.
Material temperature for transverse cracking. This value is used for hysteresis heating computations.
For plain woven materials, the solution-dependent state variables take the form:
Material state as:
1.0 No damage
1.4 Transverse matrix cracking in fill bundle
1.6 Transverse matrix cracking in warp bundle
2.0 Transverse matrix cracking in fill and warp bundles
2.2 Longitudinal cracking in fill bundle
2.3 Longitudinal cracking in warp bundle
2.7 Longitudinal cracking in fill bundle, transverse matrix cracking in warp bundle
2.8 Longitudinal cracking in warp bundle, transverse matrix cracking in fill bundle
3.0 Longitudinal cracking in fill and warp bundles
Number of cycles accompanying the given load increment. This value is always updated unless SDV1=3.0, in which case the number of cycles to failure is set to that at total failure.
Damage parameter for longitudinal cracking in the fill-matrix constituent. A value of 0.0 indicates no damage, and a value of 1.0 indicates a longitudinal crack.
Damage parameter for transverse cracking in the fill-matrix constituent. A value of 0.0 indicates no damage, and a value of 1.0 indicates a transverse crack.
Damage parameter for longitudinal cracking in the warp-matrix constituent. A value of 0.0 indicates no damage, and a value of 1.0 indicates a longitudinal crack.
Damage parameter for transverse cracking in the warp-matrix constituent. A value of 0.0 indicates no damage, and a value of 1.0 indicates a transverse crack.
Material temperature for longitudinal cracking in the fill-matrix constituent. This value is used for hysteresis heating computations.
Material temperature for transverse cracking in the fill-matrix constituent. This value is used for hysteresis heating computations.
Material temperature for longitudinal cracking in the warp-matrix constituent. This value is used for hysteresis heating computations.
Material temperature for transverse cracking in the warp-matrix constituent. This value is used for hysteresis heating computations.
Any of the above state variables may be viewed on a contour plot of the structure by following the steps outlined in this document. An example contour plot of the cycles to failure for an open hole tension specimen in ANSYS APDL is given below.
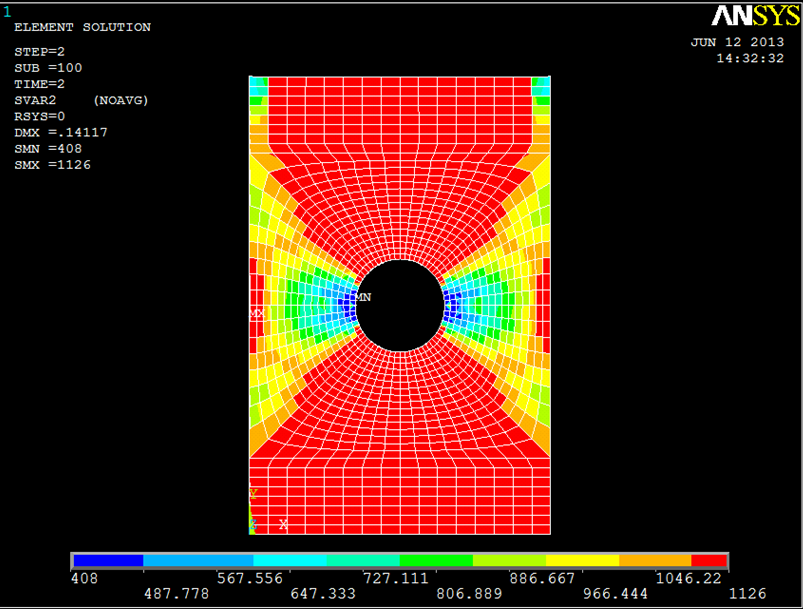
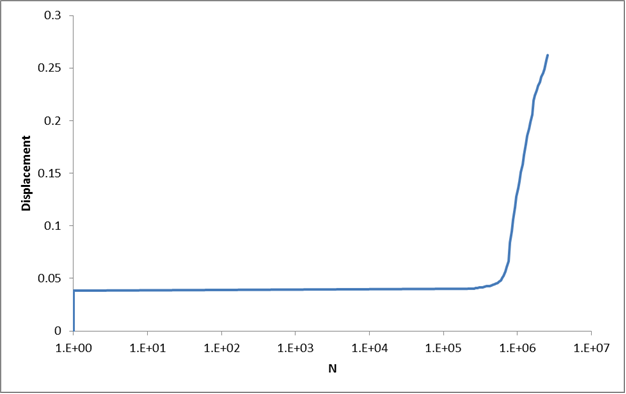
You can also use nodal displacements and the cycles to failure for un-failed regions of the structure to plot the cycles to structural failure. The above example is load-controlled, and the displacements of the top of the plate are all equal. If we plot the number of cycles in any un-failed region as a function of the displacement of the top of the plate, we can generate a plot similar to that below.