Use styles to change the appearance of objects and features in your map.
- Assign visual properties to object groups, or to objects that match certain criteria.
- Create complex styles, such as roads that display both a line style and a highway symbol, or points that use both a symbol and text.
- Call out details with attribute-driven labels that provide text along a curve and segment-stitching functionality. Use expressions to combine properties or specify formulas.
- Blend data using transparency.
- Save and reuse styles in any project, saving time and streamlining map production.
- Save display layer definitions (which include styling information and pointers to the data source) for reuse.
- Export styles to share with others.
- Use special formatting options for raster images to show hillshade, contours, and more.
Style Drawing Objects and Features
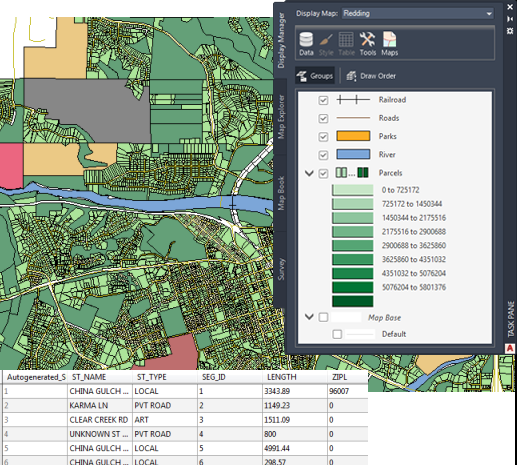
Style layers in Display Manager to change the appearance of your map.
Style Surfaces
Visualize and analyze large-scale topographic information—digital elevation models (DEM) and ESRI GRID files.
- Show elevation, slope, and aspect.
- Create contours.
- Perform sunlight studies with hill shading.
- Drape aerial photographs and vector data on topography data.
- Publish the results to 3D DWF files for viewing in free Autodesk® Design Review software. No experience with AutoCAD Map 3D toolset is required.
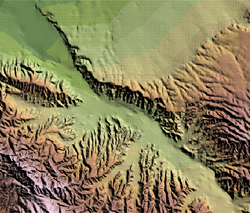
Style raster surfaces to show elevation.
Style Point Cloud Data
Style point cloud data by classification, elevation, LiDAR intensity, and RGB values.
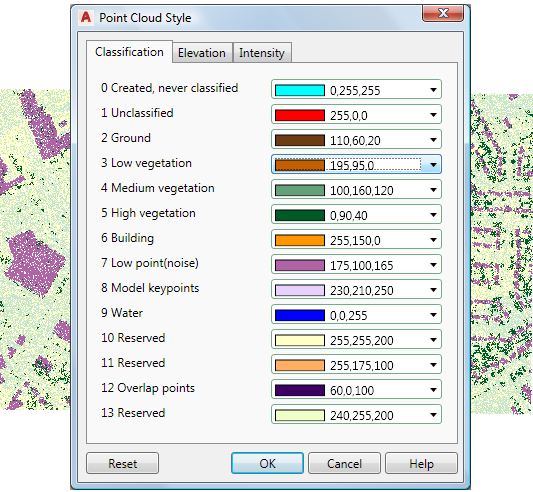
Style point clouds by classification
Tell me more
|
|
|
|
|
|
|
|
 Procedure
 Tutorial
 Related topics
 Video
Video