Profiling Center window
Use the Profiling Center to monitor scene performance and pinpoint where performance cost is highest.
Use the Profiling Center to monitor scene performance and pinpoint where performance cost is highest. You can access the Profiling Center from the Window menu or by selecting System from the asset list in the Scene Browser.
Any changes you make in the Profiling Center remain unless you modify, reset or restore them, even after MotionBuilder is restarted. In previous versions, changes had to be saved first.
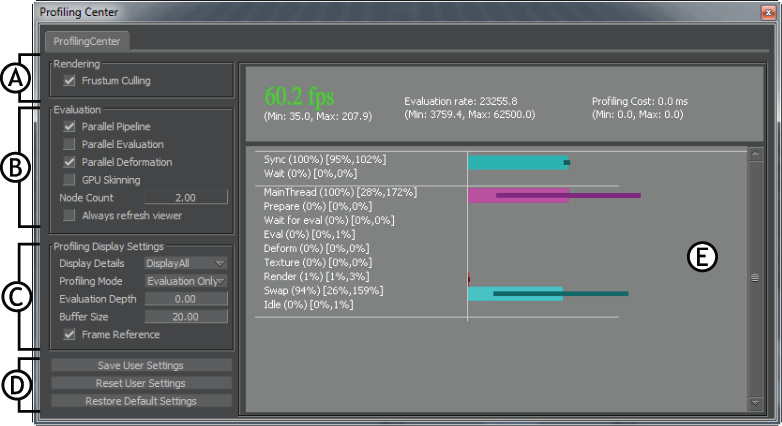
Profiling center window A. Rendering options B. Evaluation options C. Profiling Display Settings D. Setting options E. Profiling display
The Profiling center is divided into four main areas:
- Rendering options
- Evaluation options
- Profiling Display Settings
- Setting options
- Profiling display
Rendering options
Frustum Culling
When active, Frustum Culling will prevent the rendering of anything outside the confines of the Viewer window. This option is turned on by default. When this option is turned on, it appears in the evaluation line of the performance statistics, which can be displayed in the Viewer window by using the Shift-F keyboard shortcut.Tip: Use Ctrl-Shift-P to toggle the Frustum Culling setting on and off.
Evaluation options
Parallel Pipeline
Evaluates tasks consecutively.
Parallel Evaluation
Evaluates nodes in a scene including all dependencies.Important: Some MotionBuilder features that require or include pull vector operations, such as Relation Constraints, may not evaluate properly when Parallel Evaluation is on in the Profiling Center window.
Parallel Deformation
Evaluates deformation in parallel with other tasks. This option is turned on by default.
GPU Skinning
Allows you to switch between CPU and GPU skinning. GPU skinning is disabled by default on machines with four or more cores.Tip: Use Ctrl-Shift-T to toggle the GPU Skinning setting on and off.
Node Count
Displays the number of scene nodes being evaluated for each cycle.
Always refresh viewer
Keeps the Viewer window in an always active state for a particular session only.
Consider that you are viewing an animation scene in the Viewer. When you open another application, for example Windows Explorer, it opens up on top of the Viewer. Now the Windows Explorer is the active window and the Viewer window is inactive. This stops playing the animation scene in the Viewer, keeping it in an idle state. You need to bring back the focus on the Viewer to make it active and resume the play.
In the virtual production environment, it is important that the Viewer gets automatically refreshed when working with different applications. To turn on the Always refresh viewer checkbox permanently, click the Save User Settings button in the Profiling Center. This saves the setting to the MotionBuilder configuration.
Profiling Display Settings
Display Details
Select from the following Display Details options to customize the Profiling display:
DisplayAll
Shows a list of all the processes in the Profiling display.
Evaluation
Shows only the Eval process in the Profiling display.
Rendering
Shows the Render process in the Profiling display.
Devices
Shows only the Devices process in the Profiling display.
Profiling Mode
Select from the following Profiling Mode options to customize the Profiling display:
Disabled
All profiling is disabled, including Viewer profiling.
Evaluation Only
Collects profiling for all known evaluation tasks. This is the default mode.
Rendering Only
Collects profiling for all known rendering tasks.
Devices Only
Collects profiling for device input, device output and device evaluation.
SDK Only
Collects profiling for SDK.
Profile all - low
Collects profiling for all known tasks that don't increase with scene size. For large scenes selecting this option will not influence performance.
Profile all - hi
Collects profiling for all known tasks. For large scenes selecting this option will influence performance.
Evaluation Depth
This option can be set to any value between zero and ten.
- Zero is a base level evaluation that is not dependant on a profiling mode.
- Ten is the deepest level of profiling available. Setting this depth could affect performance.
Buffer Size
Setting this option to a value between zero and 200 denotes the sample size of evaluation cycles.
Frame Reference
Toggle between two profiling time displays. Enabling this option shows profiling time in MS. Disabling this option shows profiling time in reference to one frame.
Setting options
Save User Settings
Saves your settings in a session.
Reset User Settings
Resets all your previous settings.
Restore Default Settings
Restores the default settings that are in the configuration file.
Profiling display
The Profiling display contains a list of tasks and a visual representation of the time that is spent performing a task cycle.
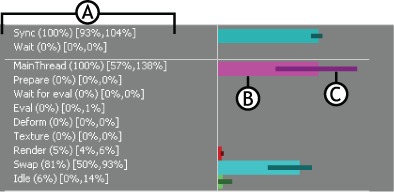
Profiling display A. Tasks B. Average time spent performing a task cycle C. Minimum and Maximum time spent performing a task cycle