To use XY Plotting of Results, right-click on the XY Plot icon under your Subcase in the Inventor Nastran tree and select New. Make sure you have either run the analysis (right-click on your Analysis in the Inventor Nastran tree and select Solve in Nastran) or loaded in the results (right-click on your Analysis in the Inventor Nastran tree and select Load Results).
The XY Plots (graphs) now display the respective units for the X and Y components.
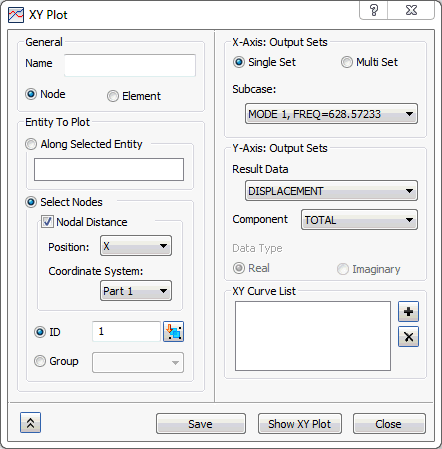
General:
- Name: Names the XY Plot.
- Node: Plots nodal output quantities such as displacement, velocity, and acceleration.
- Element: Plots elemental output quantities such as stress and strain.
 Plotting the results with respect to nodal and/or element distance is based on coordinate distance with respect to the position selected. You can filter the result data based on nodal and elemental results by selecting the respective node or element radio button.
Entity To Plot:
- Along Selected Entity: Allows you to select the sketch segments or edges in order to plot the results on it in XY Plot curve with results as Y-axis and distance as X-axis.
- Select Nodes/Elements: Allows you to select the Node/Element IDs by setting the position and reference coordinate system.
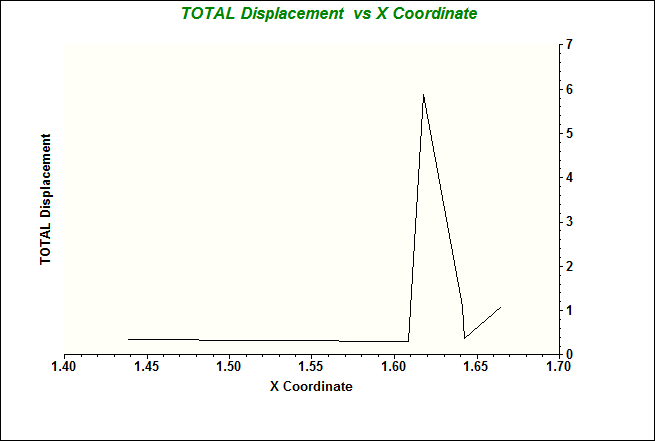
- Nodal/Elemental Distance Checked: It considers the Nodal or Elemental distance, based on the selection of Node or Element radio button.
- Position: When you select Node it takes the Nodal distance based on the position over X, Y or Z coordinates.
- Coordinate System: It allows you to define the position of Nodal/Elemental distance based on selection of coordinate system.
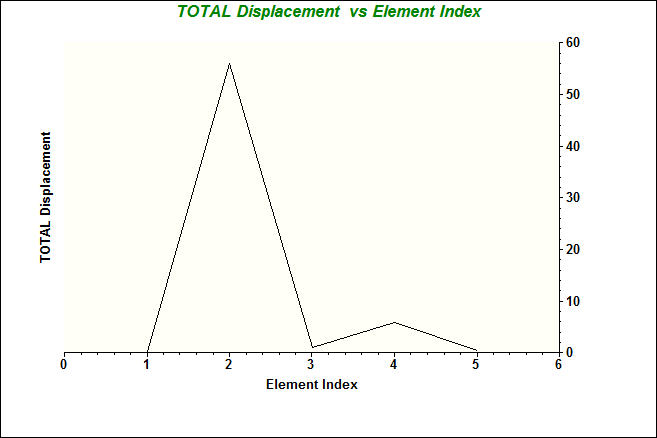
- Nodal/Elemental Distance Unchecked: It will not consider the distance; it rather plots the XY Plot based on Node/Element Index.
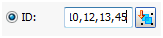
- ID: Node or Element ID. You can click on the node or element of interest to populate the ID into the selection menu. You can use the
Query Display (right-click on
Nodes or
Elements in the
Inventor Nastran Model tree) to obtain your IDs to manually enter into the selection menu. It also allows you to enter the IDs successively by entering comma (,) as shown in the below image:
- Group: Allows you to select the already defined groups.
- Nodal/Elemental Distance Checked: It considers the Nodal or Elemental distance, based on the selection of Node or Element radio button.
Output Set:
- Single Set: This is applicable for all analyses. It allows you to plot the XY Plot for the results along sketch/edge selection using the Along Selected Entity option and also for some set of nodes/elements using Select Nodes/Elements.
- Multi Set: This is applicable only for an analysis which consists of multi results for a subcase.
- Start Set: Specifies the start set of the range of output sets for the XY Plot.
- End Set: Specifies the end set of the range of output sets for the
XY Plot.
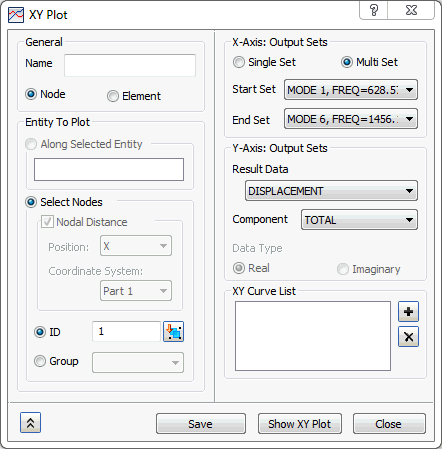
Output Vector:
- Result Data: Defines which output vector will be plotted.
- Component: Defines which vector component (if applicable) will be plotted.
-
Data Type:
- Magnitude: Appears when choosing magnitude and phase output. This is for polar information of a frequency response solution.
- Phase: Appears when choosing magnitude and phase output. This is for polar information of a frequency response solution.
- Real: Appears when choosing real and imaginary output. This is for rectangular information of a frequency response solution.
- Imaginary: Appears when choosing real and imaginary output. This is for rectangular information of a frequency response solution.
XY Curve list:
- It allows plotting multiple curves for different results for the same nodes/elements selected with other settings.
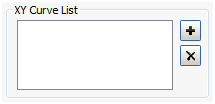
- Add: The
 button allows adding the curve to the
XY Curve list which allows plotting the added curve when you click on
Show XY Plot. If multiple curves are added without selection, it will show all curves in the XY Plot graph. If any single curve is selected from the list and then plot the curve, it will show only the selected one.
button allows adding the curve to the
XY Curve list which allows plotting the added curve when you click on
Show XY Plot. If multiple curves are added without selection, it will show all curves in the XY Plot graph. If any single curve is selected from the list and then plot the curve, it will show only the selected one.
- Delete: The
 button allows deleting the selected curve from the
XY Curve list.
button allows deleting the selected curve from the
XY Curve list.
- Add: The
- Create XY Plot: Creates the current XY Plot under the XY Plot section of the Model tree.
- Show XY Plot: Displays the XY Plot in a separate window.
- Close: Allows closing of the XY Plot dialog.