To display the measured points of section groups on the CAD model, select View tab > View Options panel > Section button. To hide the measured points, deselect the button.
PowerInspect compares the measurement results to the CAD data and uses colour to indicate the deviation from the CAD data:
- Green points are within tolerance.
- Red points are above the tolerance band.
- Blue points are below the tolerance band.
To choose the type of display, click the arrow and select:
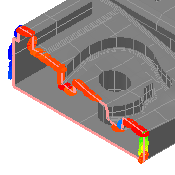
- Confetti to display the points as coloured spots. For example:
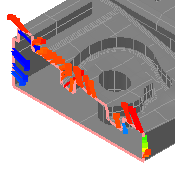
- Pins to display the points as coloured pins. The length of a pin indicates the size of the point's deviation from nominal. For example:
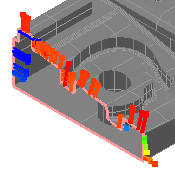
- Joined pins to display the points as joined lines. The length of a pin indicates the size of the point's deviation from nominal, and the links indicate the shape of the probed section. For example:
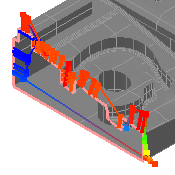
- Vector pins to display the deviation of measured points as vector lines. The direction of the line indicates the direction of deviation. For example: