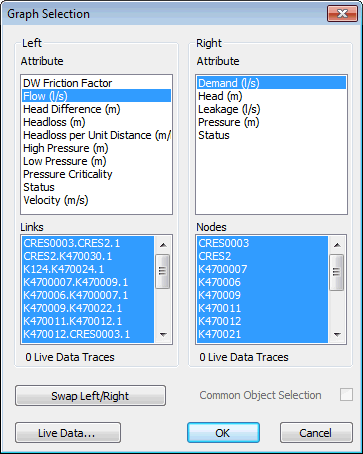
The graph selection dialog is used to display results for more than one network object on the same graph.
Tip: See Graphing selected objects for more on graphing the data of more than one network object.
To display the dialog:
- Open a simulation for replay.
- Select one or more network objects.
- Click the
 (Graph selected objects) tool on the
Operations toolbar, or select Selection | Selection operations | Graph results.

| Item | Description | ||||||
|---|---|---|---|---|---|---|---|
|
Left |
Defines what will be displayed on the left axis of the graph.
|
||||||
|
Right |
Defines what will be displayed on the right axis of the graph.
|
||||||
|
Swap Left/Right |
Switches the Left and Right lists and so switches the axes on which the data will be displayed. |
||||||
|
Common Object Selection |
Available when selected network objects are of the same type. When this box is checked, selections in the Right list are synchronised with those in the Left list. When objects are selected or deselected in either list, the change takes effect in both lists. Unchecking the box splits the lists. |
||||||
|
Live Data |
Displays the Live Data Selection dialog, for selecting live data to be plotted on the graph in addition to the results traces. |
Notes:
- If the network selection is made up of just one type of object, the full list is displayed in both panels, and two different parameters can be graphed for each object.
- If the selection contains a mixture of object types, one set of objects will be listed in the left panel and another set of objects in the right panel. One parameter can be graphed for each.
- If the selection contains all three types of object that can be graphed (nodes, links, and object groups), only the nodes and links will be displayed for graphing.
- Within the two lists, the selection can be adjusted by clicking individual entries to deselect or reselect them.