This dialog allows you to:
- change the way in which a long section is displayed in the Long Section window
- edit attributes including colours and fonts
The dialog is opened in one of the following ways:
- by selecting Long section
 Properties (the Long Section window must already be open and selected)
- by right-clicking the Long Section window and selecting Properties
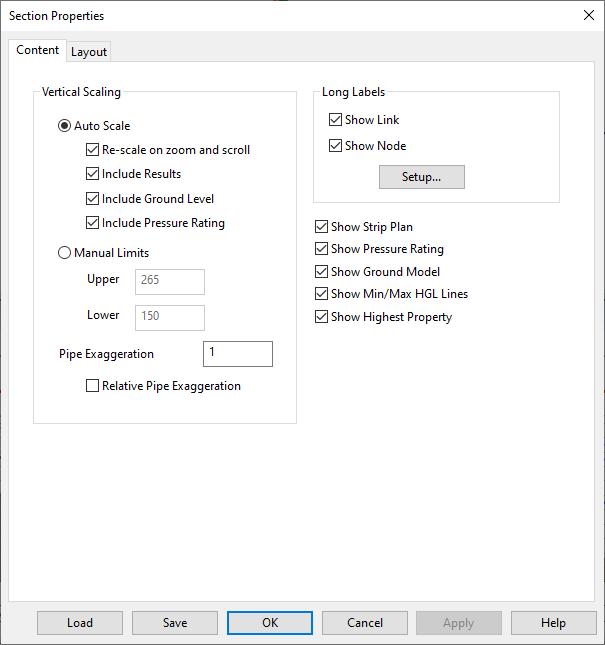
Content tab
This tab allows you to change the way in which a long section is displayed in the Long Section window.
| Item | Description | ||||||||
|---|---|---|---|---|---|---|---|---|---|
| Vertical Scaling |
You can set manual vertical scale limits for the Long Section View or allow InfoWorks WS Pro to manage the view scaling itself. You can set options for use with automatic scaling.
|
||||||||
| Long Labels |
|
||||||||
| Show Strip Plan | Shows the simple plan, running along the top of the display. The strip-plan identifies the relative position of nodes along the section. | ||||||||
| Show pressure rating | Shows the pressure rating of pipes. With the box checked, the pressure rating will shown as a single red line. | ||||||||
| Show Ground Model | Shows the line representing heights from the currently loaded ground model. | ||||||||
| Show Min/Max HGL lines | Shows the minimum/maximum hydraulic grade lines (for example, the minimum and maximum head during the simulation). These are two lines that show the minimum and maximum head/pressure. | ||||||||
| Show Highest Property | Shows the line representing the highest property. |
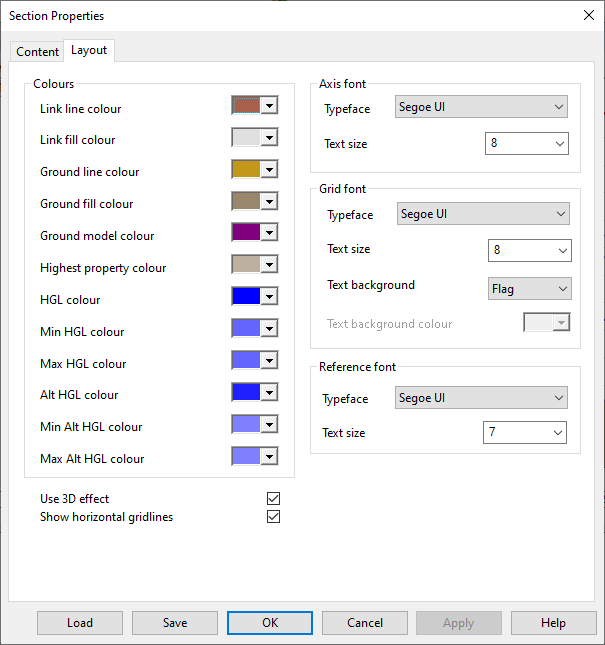
Layout tab
This tab allows attributes including colours and fonts to be edited.
|
Option |
Description |
|---|---|
| Colours |
Link line colour - colour of lines displaying links Link fill colour - link fill colour Ground line colour - colour of line displaying ground level determined from connected node ground level values Ground fill colour - colour of fill beneath ground line Ground model colour - colour of line displaying ground level determined from currently loaded ground model Highest property colour - colour of the highest property line (if shown) HGL colour - HGL colour of the base result Min HGL colour - minimum HGL colour of the base result Max HGL colour - maximum HGL colour of the base result Alt HGL colour - HGL colour of the alternate result Min Alt HGL colour - minimum HGL colour of the alternate result Mas Alt HGL colour - maximum HGL colour of the alternate result |
| Use 3D effect | Applies a visual 3D effect to pipes. |
| Show horizontal gridlines | Displays dashed horizontal lines for each tick mark. |
|
Axis font |
This section allows customisation of the axis labels font on the Long Section window. The attributes that can be edited are: Typeface Text size |
|
Grid font |
This section allows customisation of the grid labels font in the Long Section window. The grid labels are displayed at the bottom of the window. By default, the labels display the IDs of the objects contained in the long section. See Content tab to learn how to change the data shown on the labels. The attributes that can be edited are: Typeface Text size Text background- can be set to:
Text background colour - enabled only if Text background is set to User |
|
Reference font |
This section allows customisation of the autolabels displayed on the Long Section window. The attributes that can be edited are: Typeface Text Size The autolabels are usually in the form of vertical text indicating the node IDs. |
Buttons on the dialog
|
Button |
Description |
|---|---|
| Load | Displays the Load Network Editor Properties dialog, which is used to load a previously saved set of section window settings. |
| Save |
Displays the Network Editing Properties - Save Options dialog which is used to save the current section window settings. |
| OK |
Closes the dialog and applies changes to the Long Section window. |
| Cancel |
Closes the dialog and does not apply any changes to the Long Section window. |
| Apply |
Applies changes to the Long Section window without closing the dialog. |