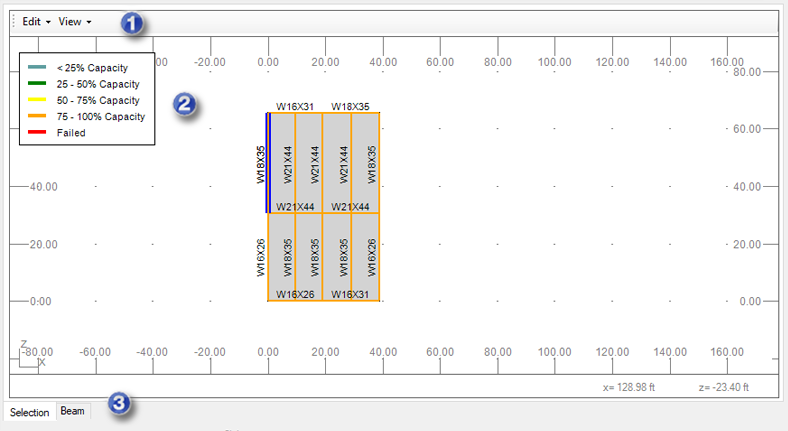
Use the graphic viewer to display an analyzed structure, beam, diagram, or calculation note, depending on a tab and settings that you select.

The graphic viewer is available on each tab of the Composite Beam Design Extension window.
- 1. Menu
-
Edit
- Composite settings. They include default settings for the design, beam and slab materials, studs, and deflections and camber. You can customize these values.
- Characteristic point. Use it to select characteristic points on a beam selected in the graphic viewer and display results for these points.
- Delete. Use it to delete a selected characteristic point directly in the viewer.
Note: On the Static Calculations tab, the Edit menu also contains:View
- Settings. Opens the View settings dialog where you select elements to display in the graphic viewer.
- Zoom All. Zooms to a view of the entire model.
- Zoom In Rectangle. Zooms in to a selected area.
- Scale. Scales objects in the structure view.
File
- Export to Microsoft Word. Sends a calculation note to a Microsoft Word® document.
- Export to Microsoft Excel. Sends a calculation note to a Microsoft Excel® document.
- Save As. Saves a calculation note as an MHT or HTML file.
- Print. Prints a calculation note.
To access the File menu, select the Report tab, and then, in the graphic viewer, select the Report tab.
- 2. Ratio Legend
-
It presents percentage ranges of the ratio and the corresponding colors. In the graphic viewer beams are marked with colors. Each color represents the percentage range in which the beam ratio is included.
- 3. Tabs
-
- Selection. It is available on all tabs in the application. Displays an analyzed structure.
- Beam. Displays a beam you selected in the graphic viewer and diagrams of shear, moment and displacement.
- Displacement, Moment and Shear.
To access these 3 tabs, click the Static calculations tab, and then select results to display: Displacement, M - moment, and V - shear force, respectively.
- Report. Displays a calculation note with design results.
To access a calculation note, click the Report tab, and then select Report at the bottom of the graphic viewer.
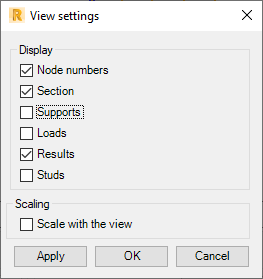
- View Settings
-
To access view settings, select View
 Settings.

- Node numbers
- Section
- Supports
- Results
- Studs.
You can select the following objects to display in the graphic viewer:
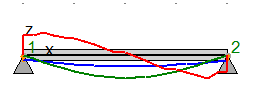
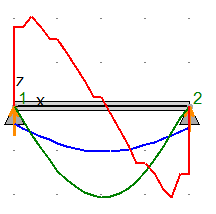
Select Scale with the view to scale diagrams while you are zooming in or out the model.
Scale with the view is off

Scale with the view is on
