The Plot Layout Tools support different methods of laying out plots. In addition to the area and frontage parameters, you can specify minimum frontage offset constraints or the use of minimum width and depth constraints. The following sections describe these methods. Experiment with these methods to see what works best for your design needs.
Layout Plot by Minimum Frontage at an Offset
Now you can use the optional minimum frontage at offset option when creating plots.
To layout plots using minimum frontage at an offset
- Click

 to open the Plot Layout Tools.
 - Enter the values for Minimum Area, Minimum Frontage, and Frontage Offset.
- Set Use Minimum Frontage At Offset to yes.
- Choose a creation tool.
- In the Create Plots - Layout dialog box, select the desired site, style, layers, and label styles. Click OK.
- Select the plot area selection label of the plot that you would like to subdivide. Or you can pick a point within the plot.
- Select start and end points of the frontage line. As you draw along the frontage, a preview line is displayed.
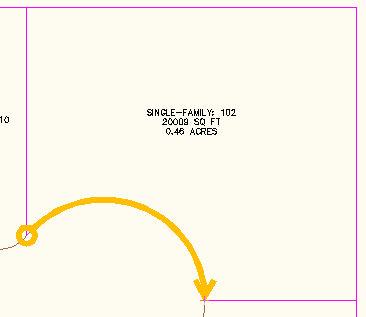
Figure 7: Frontage preview line
- Depending on the tool you selected (Slide Line, Swing Line, and so on) provide the information requested at the Command prompt.
- Preview graphics display if the proposed solution is correct. The green dashed line represents the frontage offset as shown in figure 8. Accept the resulting solution or enter No to end the command so that you can adjust the sizing parameters.
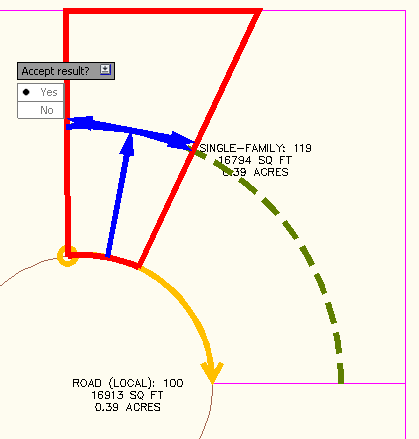
Figure 8: Preview of proposed solution and frontage offset line
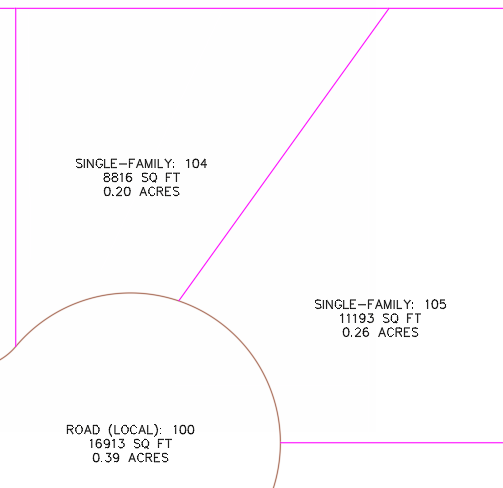
Figure 9: The new plot is created
Lay Out Plot by Minimum Depth and Minimum Width
Now you can lay out a plot by specifying a minimum area, a minimum frontage, a minimum depth, and minimum width at the minimum depth.
To layout plots using minimum width and minimum depth
- Click to open the Plot Layout Tools.
- Enter the values for Minimum Area, Minimum Frontage, Frontage Offset, Minimum Width, Minimum Depth, and Maximum Depth.
- Set Use Maximum Depth to Yes.
- Choose a creation tool.
- In the Create Plots - Layout dialog box, select the desired site, style, layers, and label styles. Click OK.
- Pick a point inside the plot that you would like to subdivide.
- Select start and end points of the frontage line. As you draw along the frontage, a temporary line is displayed.
- Depending on the tool you selected (Slide Line, Swing Line, and so on) provide the information requested at the Command prompt.
- Preview graphics display if the proposed solution is correct as shown in figure 10. Accept the resulting solution or enter No to end the command so that you can adjust the sizing parameters. Figure 10 displays preview graphics with Automatic mode turned on.
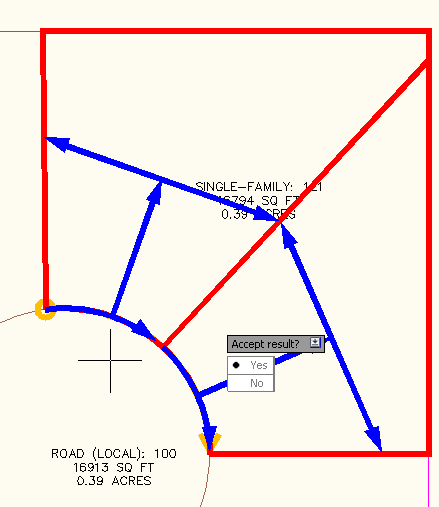
Figure 10: Proposed solution using maximum depth criteria
If you accept the proposed solution, the new plots are created as shown in figure 11.
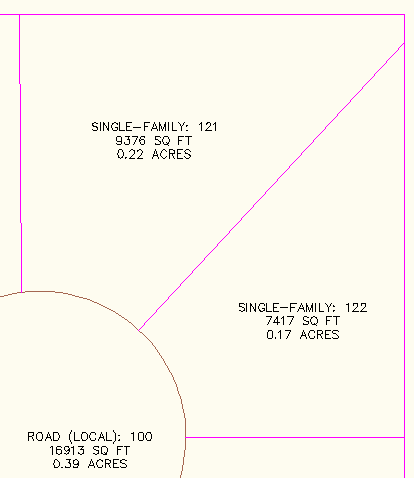
Figure 11: The new plots are created
Marissa Jenkinson, a Sales Applications Engineer for CADD Microsystems, Inc., (http://www.caddmicro.com) based in Alexandria, Virginia, U.S.A., has contributed content to this plot creation section as well as to the plot editing best practice information.