New Curves in MasterGrade
New curves enhance MasterGrade colour grading capabilities.
Flame Learning Channel: Grading with Advanced HDR Curves
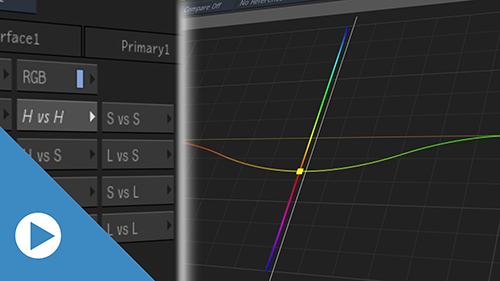
New colour curves are now available in MasterGrade, in the Curves menu.
About Curves and the MasterGrade Processing Pipeline
The curves are not rendered sequentially but in parallel. All curves are rendered after MasterGrade Primary and Tone controls.
Bypassing a Curve
A blue LED identifies the edited curves inside the curve selection drop-down and on individual buttons.

Bypass a curve by clicking the blue LED on the curve selection button.
Reset a curve by Alt+click the blue LED of the curve.
Plotting Colours
To work on a specific colour, use the Plot button.
To plot a colour:
Click
 .
.In the Viewport, click the pixel to plot it on the curve.
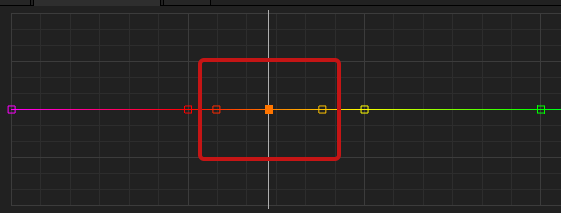
In addition to the plotted colour, two points are added to the curve, one on each side of the plotted colour. These points isolate the plotted colour, helping you edit only the colour you selected.
Note: No points are added when a point exists nearby.Before plotting the colour Plotted Colour with isolation points 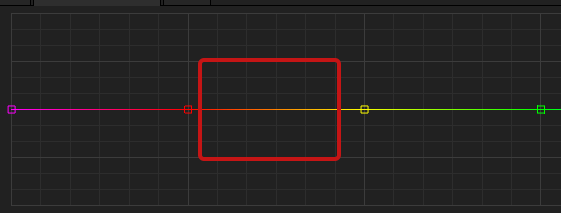
| Colour picker with zoom | Colour being picked displayed on the curve |
|---|---|
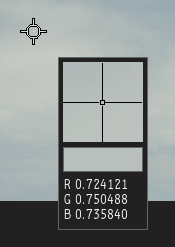 |  |
The Plot button offers two modes:
- Plot Front View samples the original, ungraded image.
- Plot Current View samples the pixel as shown in the Viewport, with all the grading applied.
Gear Menu
Use the Gear menu to access many functions and preferences.
Display vertical lines that highlight the plotted colour on the curve:

 Show Sampler Colours
Display a grid on the Curves canvas background:
- Show/Hide Grid
You can display a vertical colour preview in the three Hue vs. curves. It appears when you move gesturally a point, and it gives you preview of the outcome.
- Show/Hide Vertical Preview
Resets the selected curve:
- Reset Selected Curve
Resets all curves in the RGB mode:
- Reset RGB Curves
Resets all curves in the MasterGrade node:
- Reset All Curves
Frames the selected points on a curve:
- Frame Selected
Frames all points of a curve:
- Frame All
Resets the curves display to its original position and size:
- Home