Apply Constraints
- In the tree view, right-click on Constraints and choose New.
- Select the wider end of the wing.
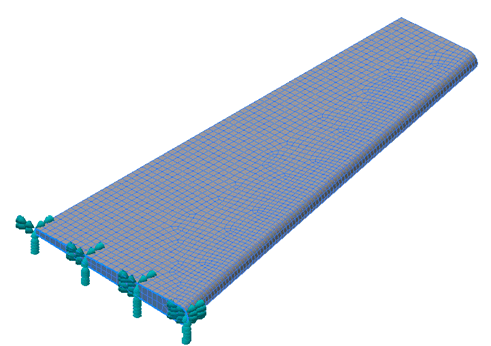
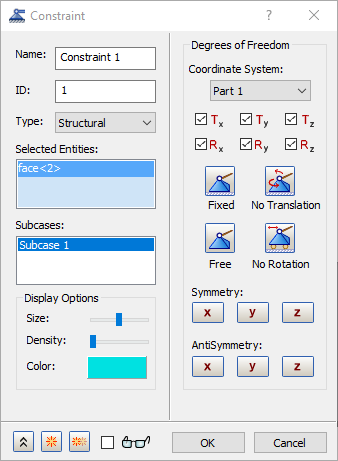
- Click OK to finish defining the constraint.
Apply Loads
- Right-click on Loads and choose New.
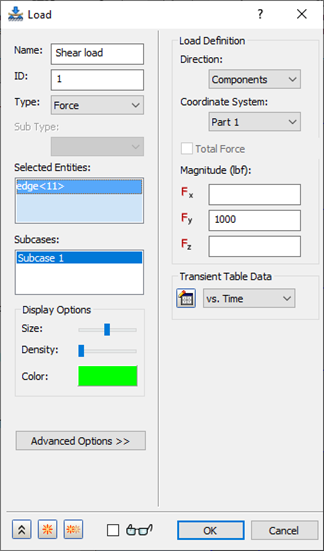
- Change the Name to Shear Load.
- Select the edge on the outside surface (smaller end) as shown in the pictures below.
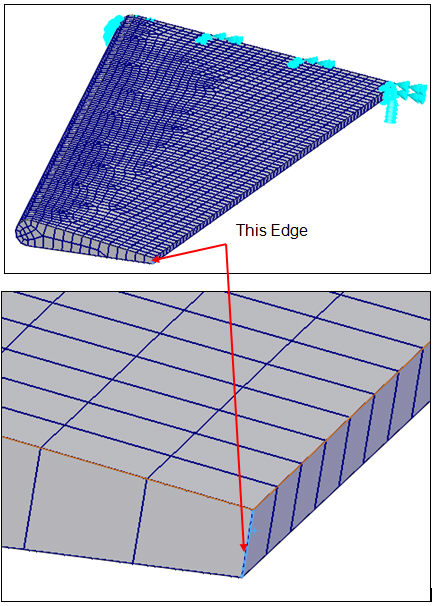
- Enter 1000 in the Fy field under Load Definition.
- Click the
 New Table button next to the drop-down, under the
Transient Table Data section.
New Table button next to the drop-down, under the
Transient Table Data section.
- When the Table Data – ‘Table 1’ dialog appears, change the Name to vs. Time, or you can leave it as Table 1.
- From the Type drop-down select Load Scale Factor vs. Time.
- Copy the data from the table below and paste it into the dialog (or simply type in the values).
Time Load Scale Factor 0 0 0.005 0.159318207 0.01 0.314566561 0.015 0.461779176 0.02 0.597195441 0.025 0.717356091 0.03 0.819191568 0.035 0.900100442 0.04 0.95801586 0.045 0.991458348 0.05 0.999573603 0.055 0.982154317 0.06 0.939645474 0.065 0.87313298 0.07 0.784315925 0.075 0.675463181 0.08 0.549355436 0.085 0.40921417 0.09 0.25861935 0.095 0.101417986 0.1 0 0.11 0 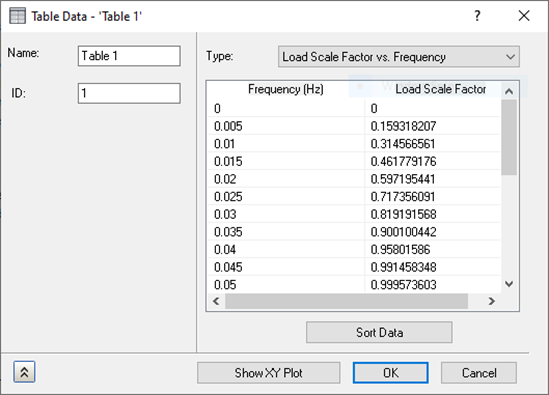
- Click OK to define the table.
- Click
OK once more to finish defining the load.
 The
button will turn to
The
button will turn to
 once a table is defined. The star in the corner of the button means NEW and the pencil means EDIT. If the drop-down is changed back to New Table, then the little button will change to allow you to define a new table.
Define Damping
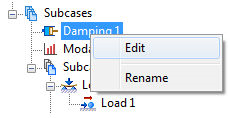
- In the
Part tree, right-click on
Damping 1 under
Subcases and choose
Edit.
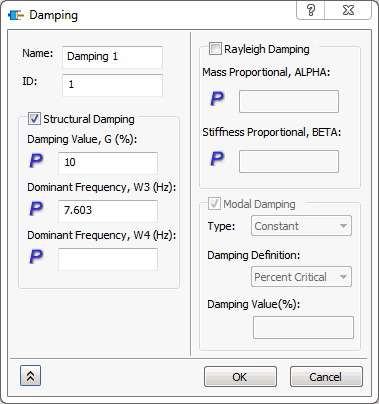
- Select the
Structural Damping checkbox. Type in
10 for the
Damping Value and
7.603 for the
Dominant Frequency.
 A modal analysis was performed to determine the dominant frequency for this model. This is typically the first natural frequency.
- Click OK.
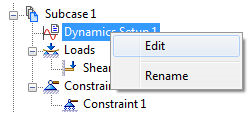
Define the Dynamics Setup
- In the tree view, right-click on
Dynamics Setup 1 and choose
Edit.
- Type in
0.005 for
Time Step and
60 for
Number of Timesteps.
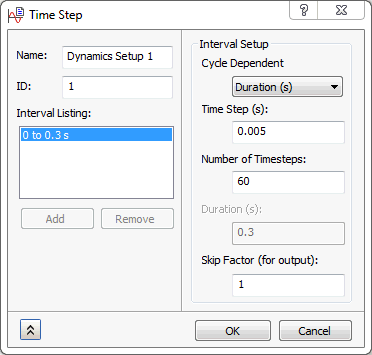
- Click OK.