Exercise 15
Previous: Chapter 21 | Next: Chapter 22
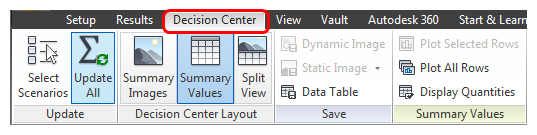
This exercise teaches how to use the Decision Center to organize and review critical results images and data for evaluating a design.
To begin, open the Decision Center by clicking the Decision Center tab.
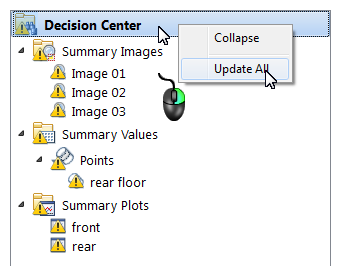
To update all summary items, right click on the Decision Center bar, and click Update all.
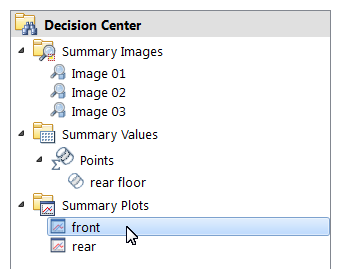
To plot temperature for the front and rear occupants, click on each XY plot in the Decision Center:
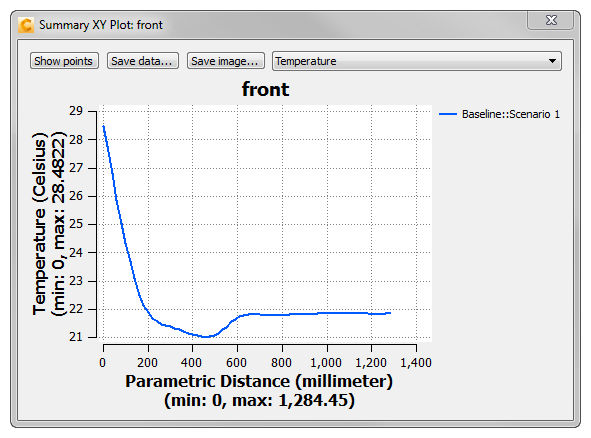
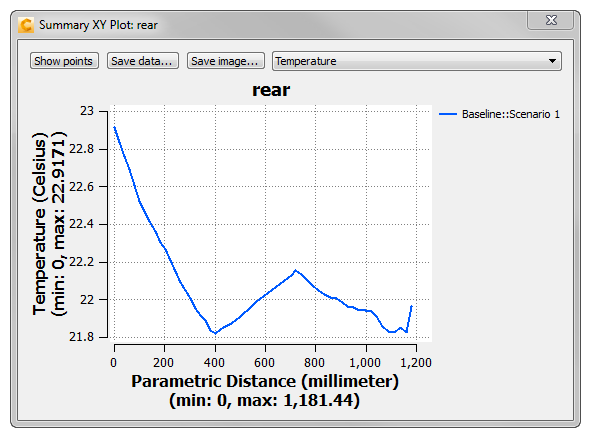 Note: These plots reveal the following observations:
- The feet of the front occupant are approximately 6°C warmer than the rest of his body.
- The temperature distribution across the rear occupant is less uniform than the front occupant.
- The feet of the rear occupant are approximately 1°C warmer than the rest of his body.
- The rear occupant is slightly warmer than the front occupant.
Close both XY plots.
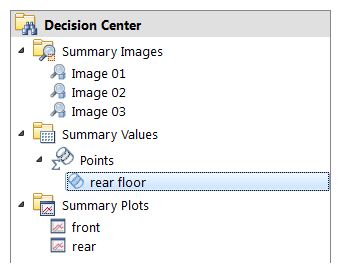
Left click on the "rear floor" summary point in the Decision Center:
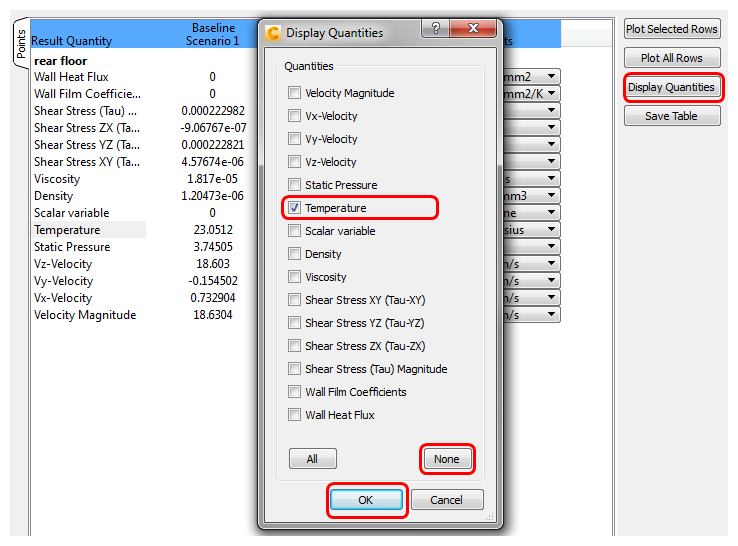
To see just the temperature result at the Summary Point, click Display Quantities. On the Display Quantities dialog, click None, and then check Temperature. Click OK.
Click on the Temperature row, and click Plot Selected Rows:
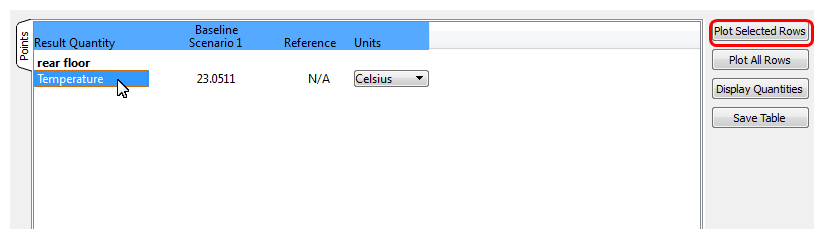 Note: Notice the temperature at this location.
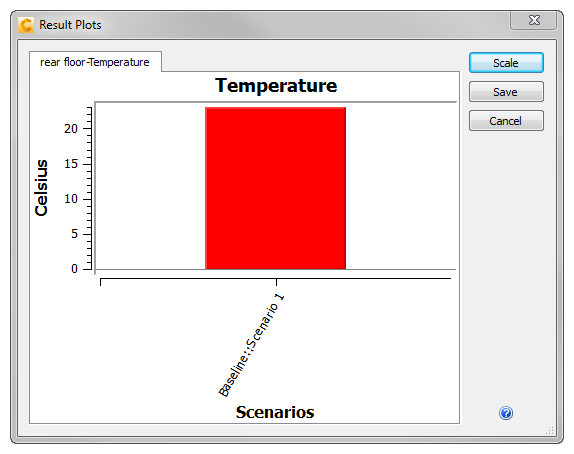
Close the plot window by clicking the "X" in the top right corner of the dialog.
To show summary images, click each entry in the Summary Images list in the Decision Center:
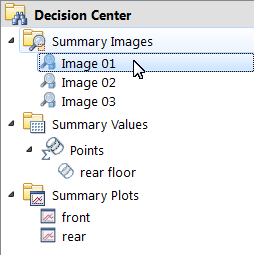
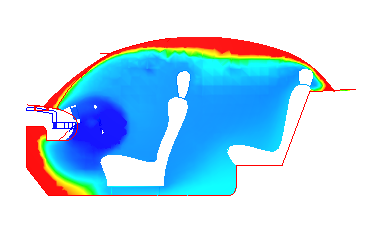
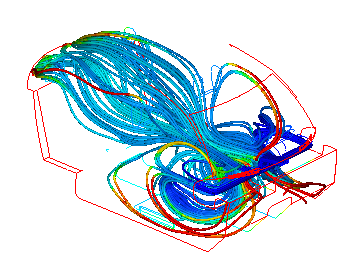
Right click on each image in the Decision Center, and rename the images as shown:
- Image1 --> "Cut through seats"
- Image2 --> "Traces"
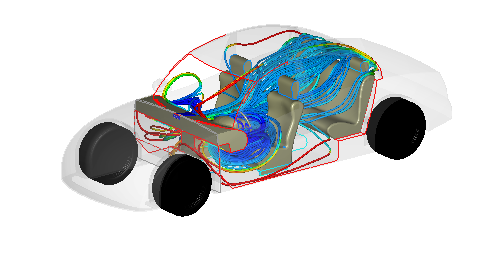
- Image 3 --> Traces with car"
Conclusion
The results indicate an uneven temperature distribution and poor airflow performance near the floor. We will analyze a modified design configuration to attempt to resolve these issues.
Recall that we used the Summary Images, Summary XY plots, and several additional results images to make this decision.