Exercise 12
Previous: Chapter 18 | Next: Chapter 19
This exercise teaches how to use Iso Surfaces to visualize flow characteristics in 3D.
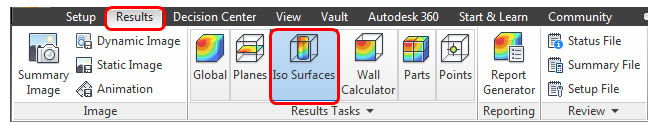
Click Iso Surfaces from the Results tab:
Reset the legend range:
- Right click on the legend and select Options.
- Click Reset in the User Specified Range section of the dialog.
- Close the Legend Options dialog.
Right click off the model and select Add iso surface. (Alternatively, click Add from the Iso Surfaces context panel.)
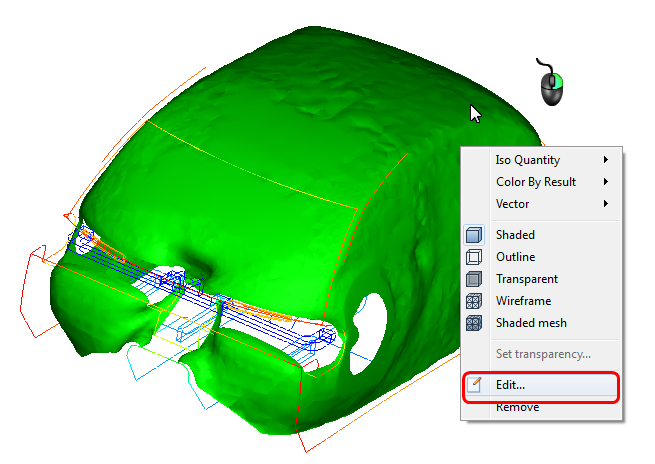
Right click on the Iso Surface and select Edit.
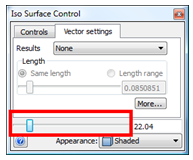
Drag the slider bar to change the temperature value of the iso surface:
Drag it to the left to identify lower temperature regions:
Drag it to the right to see where the temperature is higher:
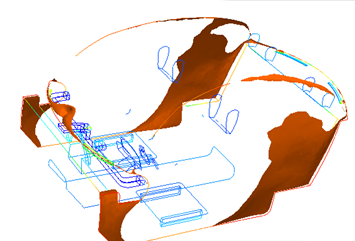 Note: Use Iso Surfaces to identify asymmetry in the flow. Also note the locations of the highest temperature areas.
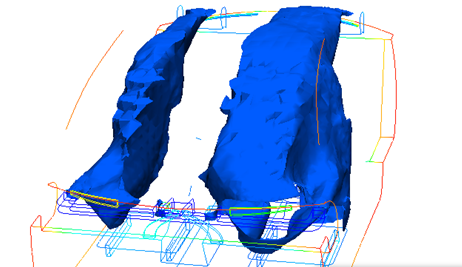
Change the Iso quantity and the Color by result to Velocity Magnitude. Drag the slider to the left until the flow jets from the front registers are visible.
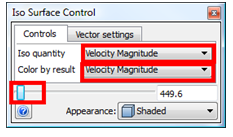
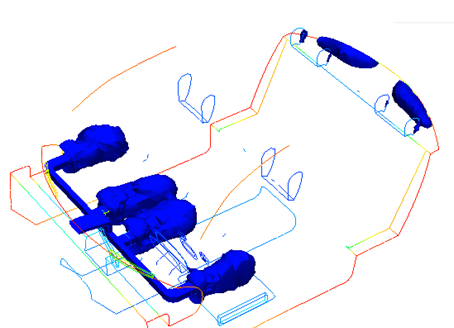
Change the Color by result to Temperature.
Note: Note where the air temperature starts to increase: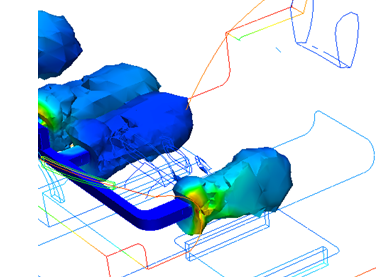
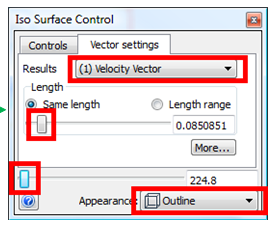
Click the Vector Settings tab. Select Velocity Vector from the Results menu. Change the Appearance to Outline. Drag the Length and Value sliders to view the flow within the cabin.
 Note: Note the areas with strong flow recirculation:
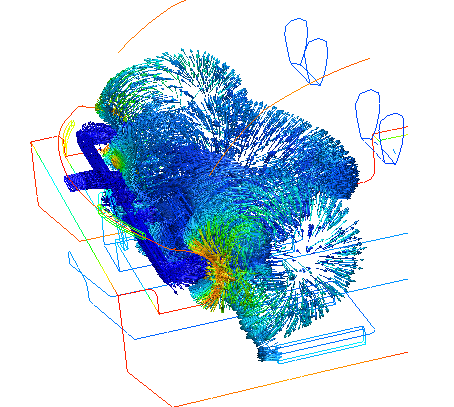
Delete the Iso Surface: Right click on it and select Remove.