Deliverables
During an automation run in ASBD, the following files are created as deliverables:
| Item | Folder | Description |
|---|---|---|
| Output json | Json | This is the JSON output file that contains key values from the analysis run by each command. It is referenced by the outputFilename JSON item. |
| Log | Log | This is the text file that contains the progress log of the automation run. It is referenced by the logFilename JSON item. |
| ASBD model | Model | This is the binary file for the ASBD model. It is referenced by the modelFilename JSON item. |
| Design report | Report | This is the design report generated during the automation run. It is saved as a PDF file and is referenced by the reportFilename JSON item. |
| Image | Report\Graphics_* | The graphics folder contains the graphic files in PNG format that are referenced in the output JSON file. Each automation run has a unique graphics folder name. |
Output
The output content depends on the type of analysis being performed. For design beams it typically includes critical effects, such as:
{
  "parameters": {
    "type": "LIVE_BENDING",
    "limitState": "SLS",
    "loadCombination": 2,
    "classType": 2,
    "componentType": "GIRDER",
    "fibreType": "TOP",
    "stressType": "MIN",
    "loadOriginType": "MAX_NEG"
  },
  "spanPos": "23.438m",
  "spanPosRatio": 0.963,
  "design": "2.57MPa",
  "allowable": "-3.71MPa",
  "ratio": 0.69,
  "graphicsFile": "Graphics_20019210\\LIVE_BENDING_SLS_(Live_load_BM_2___Max_Hog)_3-1.png"
},
{
  "parameters": {
    "type": "ERECTION",
    "limitState": "SLS",
    "loadCombination": 1,
    "classType": 2,
    "componentType": "GIRDER"
  },
  "spanPos": "21.438m",
  "spanPosRatio": 0.88,
  "design": "-2.53MPa",
  "allowable": "-3.71MPa",
  "ratio": 0.68,
  "graphicsFile": "Graphics_20019210\\ERECTION_SLS_(Erection_of_beam)_4-1.png"
}
Here is an example for Design Section Shear analysis.
{
  "commands" : [
    {
      "commandID" : "DS_C1",
      "action" : {
        "status" : "OK",
        "results" : {
          "sectionRef" : "SS1",
          "analysisType" : "SHEAR",
          "limitState" : "LS_ACCIDENTAL",
          "loadcase" : "SL1: Pile at 5.2m depth",
          "cracked" : "true",
          "lambda1" : "0.8503",
          "lambda2" : "1",
          "shearWidth" : "950.0mm",
          "shearDepth" : "950.0mm",
          "maxShearCapacity" : "8091.92kN",
          "appliedShear" : "211.50kN",
          "reqdTransverseRft" : "5157.0mm²/m",
          "z_over_d": "1.112"
        }
      }
    }
  ]
}
For a design beam, when using SELECTED or ALL points of interest, the output includes additional analysis results and geometric properties at each location. Here is an example of a beam shear result at a selected point of interest:
{
  "commandID": "AU_PT_SHEAR_SELECTED",
  "action": {
    "status": "OK",
    "results": [
      {
        "request": "PERFORMANCE",
        "values": [
          {
            "parameters": {
              "type": "LIVE_SHEAR",
              "limitState": "ULS",
              "loadCombination": 1,
              "class": 2
            },
            "spanPos": "6.0875m",
            "spanPosRatio": 0.25,
            "design": "611.06kN",
            "allowable": "769.32kN",
            "ratio": 0.794,
            "capacityReductionFactor": 0.72,
            "minShearCapacity": "1168.72kN",
            "minTransverseRft": "177.99mm²/m",
            "reqdTransverseRft": "177.99mm²/m",
            "maxLinkSpacing": "0.6m",
            "longRftShearTension": "9626.44mm²",
            "material": {
              "precast": { "modularRatio": 1.0 },
              "stage1Composite": { "modularRatio": 0.877 }
            },
            "geometry": {
              "precast": {
                "area": "501125mm²",
                "depth": "1700mm",
                "centroid": { "x": "0mm", "y": "895.95mm" },
                "secondMomentOfArea": { "xx": "201703738536mm⁴", "yy": "19690013021mm⁴" },
                "sectionModulus": { "top": "250859809mm³", "bottom": "-225128252mm³" },
                ...
              },
              "stage1Composite": { ... }
            }
          }
        ]
      }
    ]
  }
}
The values in the output can be presented either as numerical values or as formatted strings that include the corresponding units. The numerical values are output in default metric units unless the control settings item useProjectUnits ($id="#/properties/control/properties/settings/properties/userFormat/properties/useProjectUnits") is defined and set to true. In this case, the units are set according to the project.
Legacy Output Tags
In SBD 2027, output tag names were standardized from code-specific names to generic names that work across all design codes. For example, V_Rd,max (Eurocode), phi.Vc_max (Australian Standard), and Vmax (AASHTO LRFD) are now all output as maxShearCapacity. Section geometry properties were also restructured from flat tags (e.g. centroid_y, Iyy) into a nested geometry object (e.g. geometry.centroid.y, geometry.secondMomentOfArea.yy).
If you have existing automation scripts that reference the pre-2027 tag names, set the includeLegacyItems control setting to true to include the old tags in the output alongside the current tags. This allows a gradual migration to the new naming without breaking existing workflows. The default is false, which outputs only the current tags.
{
  "control": {
    "settings": {
      "includeLegacyItems": true
    }
  }
}
When enabled, the following output tags include their legacy equivalents:
Shear parameters (legacy tags vary by design code):
| Current Tag | Eurocode | AASHTO LRFD | Australian Standard |
|---|---|---|---|
maxShearCapacity |
V_Rd,max |
Vn_max |
phi.Vu_max |
minShearCapacity |
V_Rd,c |
Vn_min |
Vu_min |
appliedShear |
V_Ed |
Vu |
V*_eq |
reqdTransverseRft |
Asw_per_s |
Av_per_s |
Asv_per_s |
Section geometry properties (legacy tags are flat, current tags are nested under geometry):
| Current Tag | Legacy Tag | Applies To |
|---|---|---|
geometry.area |
area |
All |
geometry.centroid |
centroid_x |
Non-EU |
geometry.centroid |
centroid_y |
All |
geometry.centroid |
centroid_z |
EU |
geometry.secondMomentOfArea |
Ixx |
Non-EU |
geometry.secondMomentOfArea |
Iyy |
All |
geometry.secondMomentOfArea |
Izz |
EU |
geometry.boundingBox |
max_y |
Non-EU |
geometry.boundingBox |
max_z |
EU |
geometry.boundingBox |
min_y |
Non-EU |
geometry.boundingBox |
min_z |
EU |
geometry.principalAngle |
angle_xx_to_uu |
Non-EU |
geometry.principalAngle |
angle_yy_to_uu |
EU |
Plastic properties:
| Current Tag | Legacy Tag |
|---|---|
geometry.plasticModulus |
plasticModulus_Zp |
results.plasticMoment |
plasticMoment_Mp |
Log
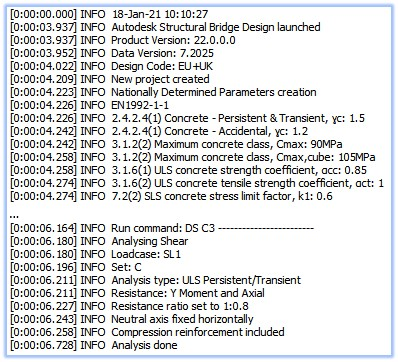
The progress log is a text file that provides a detailed record of the model data and commands as they are processed during the automation run. It also includes any warnings or errors encountered during that process. The log file is useful for troubleshooting and understanding the execution flow of the automation.
Report
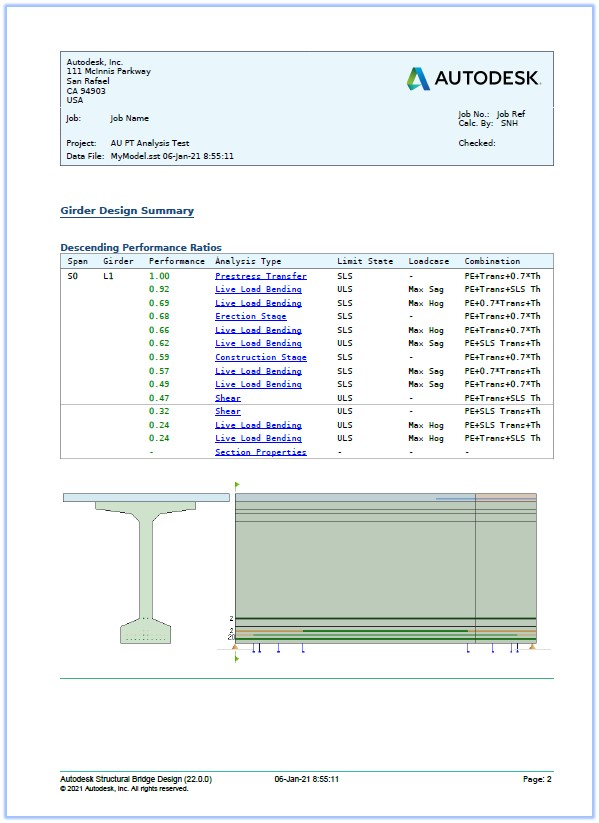
The design report is an optional output in PDF format that provides a comprehensive overview of the calculations performed for a section or beam. It includes detailed information on the design calculations, such as critical effects, performance ratios, and other relevant parameters. The report often includes hyperlinks that allow easy navigation between the summary table and the detailed calculations, providing a comprehensive understanding of the design analysis.