9.2 Dynamics - Normal Modes Analysis - Simple Footbridge
Subjects Covered
- Steel Footbridge
- Normal Modes
- Natural Frequencies
- Mode Shapes
- Participation Factors
- Sturm Sequence Checks
- Structural Mass
- Density
- Lumped Mass
- Dynamic Compilations
- Animation
Outline
Many structures have dynamic characteristics which are undesirable and, if not checked, would fail to meet certain design requirements. Footbridges are structures which are often susceptible to dynamic problems caused by wind or simply by pedestrians using the structure. These vibrations can sometimes be excessive and although they may not cause any structural failure, they may cause discomfort and alarm to any user of the bridge.
It is therefore generally required to check that undamped natural frequencies of footbridges do not fall within a specified range.
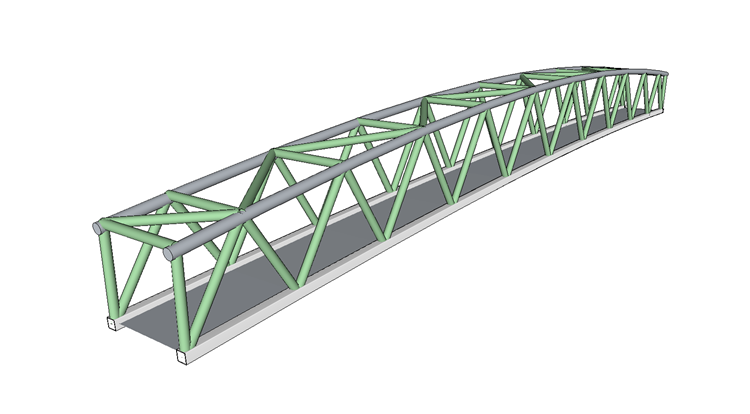
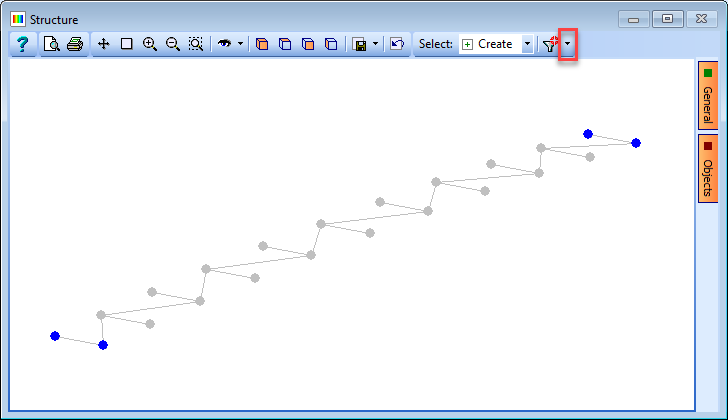
In the following example, the vibration modes of a tubular steel footbridge, as described and modelled in example 6.3, are to be examined.
It is required to establish the undamped natural frequencies and mode shapes of:
- The fundamental vertical bending mode
- The fundamental horizontal bending mode
- The first torsional mode
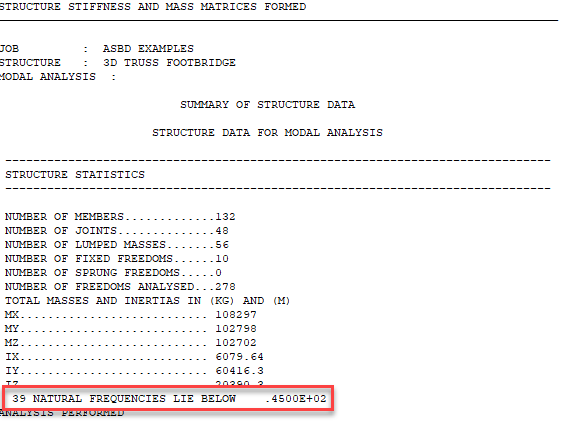
It is also required to establish how many vibration modes there are below 45Hz and if all these modes are considered, what percentage of mass participation is achieved in the vertical and transverse horizontal directions.
The total mass acting on the structure is made up from the structural mass of the structure members which we assume to have a weight density of 78.0kN/m³ (to include a small amount for paint etc and connections) and some non-structural mass, due to surface finishing of the deck, of 0.7kN/m².
Procedure
-
Start the program and open the data file with a name of “EU Example 6_3.sst” which was created in example 6.3.
-
Close the Structure overview with the “Done” button.
-
Change the Title sub title of the example to “Example 9.2” using the File | Titles... menu option.
-
Change the Job Number: to “9.2” and put your initials in the Calculations by: field before closing the form in the normal way.
Structural Mass
To check the structural mass applied to the structure we can look at a data report to inspect the densities applied to each member.
-
Click on the Menu item File | Data Reports... to open the Data Reports form. Scroll to the bottom of the form and tick to include Section Property Data then click on the “View” button.
-
Click ✓ OK on any warning message may that appear.
-
Inspect the density of each of the properties. You will notice that they are all 77kN/m³.
-
Close the Results Viewer with the green EXIT button and then the Data Reports form with the ✓ Done button.
The density is generally defined in the property definitions, so these could be changed here but in this example we will show how to be more specific in changing densities for individual members/elements.
-
Change the navigation window to Structure Properties by clicking on the appropriate button at the bottom.
-
Click on
 at the top of the navigation window and select Advanced Beam Assignments | Modified Density from the dropdown list.
 -
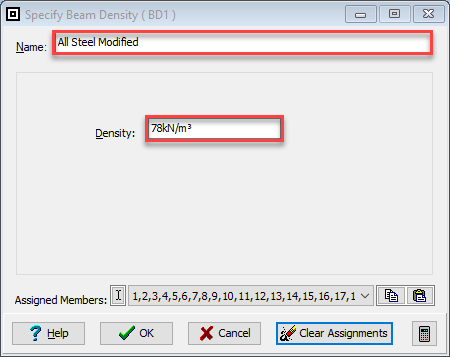
Change Name: to be “All Steel Modified” and the Density: to “78”.
-
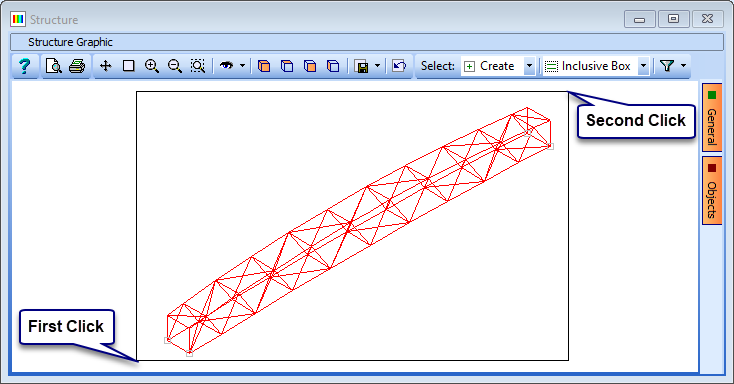
Now window round the whole structure in the graphics window to select all the members.
-
Close the Specify Beam Density form with the ✓ OK button.
Surfacing Mass
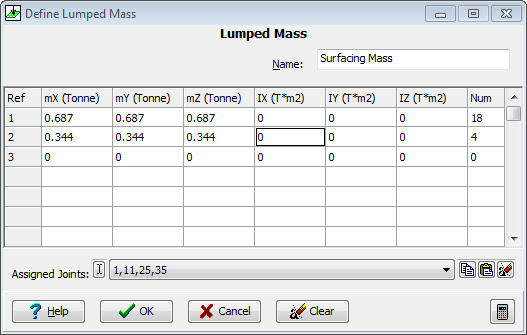
The surfacing mass of 0.7 kN/m² is to be added as Lumped mass on the nodes of the bottom boom. The deck is 55m long and 3.5 m wide so the added weight is 134.75kN. This will be applied to the 22 nodes in the deck, with the two end nodes at each end having half the mass of the others. This works out to 6.74kN (0.687Tonnes) on internal nodes and 3.37kN (0.344Tonnes) on the end nodes.
-
Change the navigation window to Structure Loads and click on
in the toolbar and select Lumped Mass from the dropdown list. -
In the first row set mX mY and mZ to be all “0.687” and then click on each of the 18 inner nodes in the deck. (This may be easier to see by filtering in the “Bottom Bracing Deck” sub-model).
-
In the second row set mX mY and mZ to be all “0.344” and then click on each of the 4 end nodes in the deck. (Don’t forget to remove the filter if you applied it in the step before).
-
Change Name: to be “Surfacing Mass” and then close the form with the ✓ OK button.
-
To enable the addition of this into the structural mass we need to create a dynamic compilation with this mass in it. Change the navigation window to Structure Compilations.
-
Click on
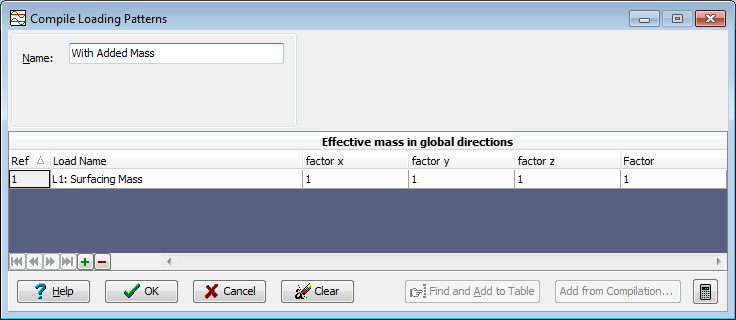
at the top of the navigation window and select Dynamic from the dropdown list. Click on the “+” button near the bottom of the form to add a row to the table. -
In the first row of the table we select the Load Name as “Surfacing Mass”. The default value for the Factor is 1.0 which is correct.
-
Change the Name to “With Added Mass” before closing the form with the ✓ OK button.
Analysis
-
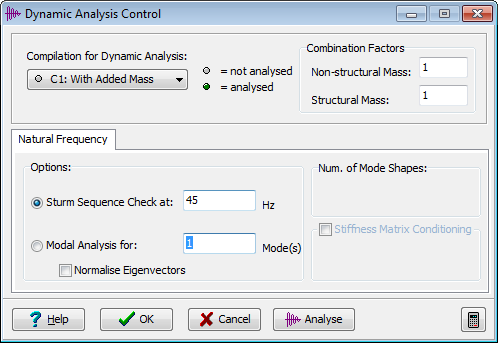
In the main menu select Calculate | Dynamic Analysis... to open the Dynamic Analysis Control form.
-
Set the Compilation for Dynamic Analysis: data field to “C1: With Added Mass”.
-
The first analysis is a Sturm Sequence Check which checks the number of modes below a given frequency. Check that this option is selected on the data form and enter a frequency of “45”.
-
Click on the Analyse button. Click OK on a warning message that may appear.
-
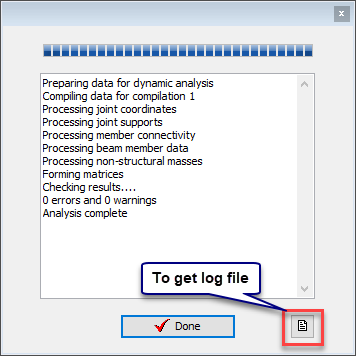
When the analysis is complete click on the “Log File” icon at the bottom righthand corner of the Analysis form to open up the log file. This should report that there are 39 modes below 45 Hz.
-
Close the Analysis Log File with the green EXIT button and the Analysis form with the ✓ Done button.
-
On the Dynamics Analysis Control form (which should still be open) select the Modal Analysis for: radio button and set the data field to 39 Modes.
-
Click on the Analyse button. (The software may take a few seconds to perform the analysis).
-
When the analysis is complete, close the analysis form with ✓ Done and close the Dynamic Analysis Control form with the ✓ OK button.
-
Open the Results Viewer using the Menu item File | Results....
-
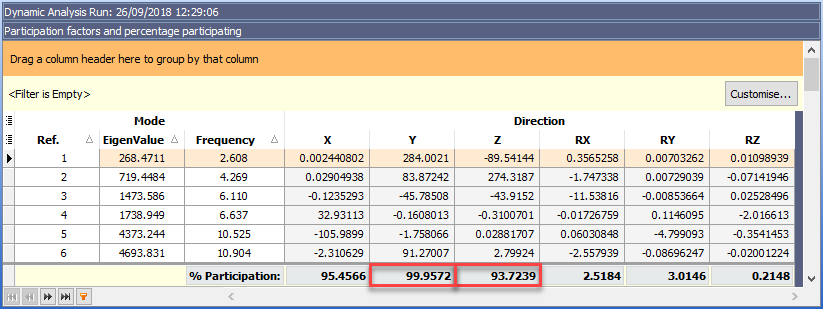
In the dark blue Results Control area tick the Show Participation Factors tick box to display the following table.
-
The percentage mass participation (at the bottom of the table) shows 93.7% vertically and almost 100% laterally.
-
On inspection of the displacement participation factors for each of the first few modes, it is clear that the first vertical deflection mode is mode 2 and the first lateral deflection mode is mode 1.
-
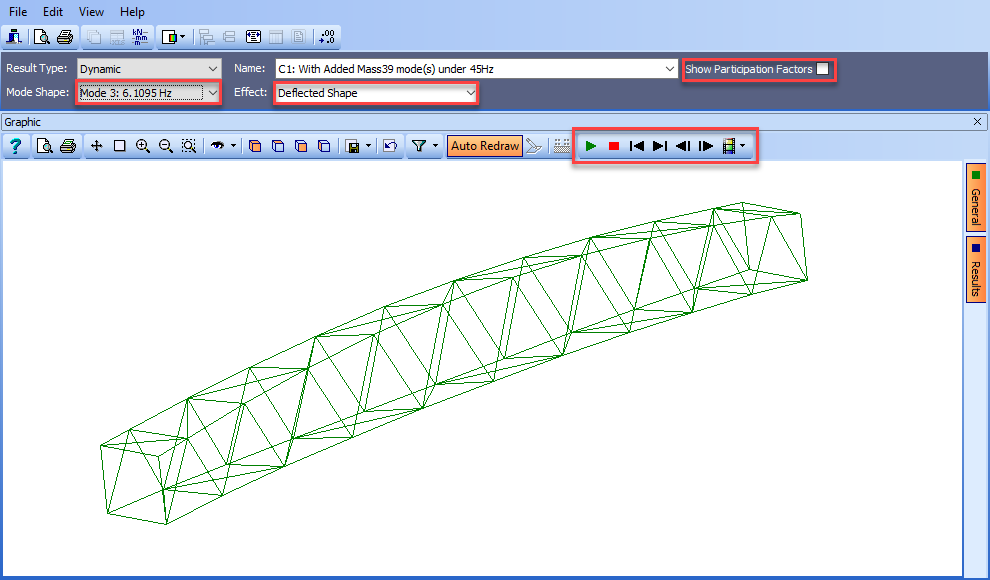
These mode shapes can be visually checked by un-ticking the Show Participation Factors tick box, setting Effect to “Deflected Shape” and clicking on the “Auto Redraw” button on the graphics toolbar. Each mode can then be selected in the Mode Shape data field and the mode shape will be displayed.
-
It may be easier to interpret the shapes if they are viewed in animation by using the controls in the graphics toolbar. It is clear that mode 3 is the first twisting mode.
-
Close the Results Viewer.
-
Use the main menu File | Save As... to save the data file with a name of “My EU Example 9_2.sst”.
-
Close the program.
Summary
This example shows the very basics of carrying out a normal modes analysis using an Autodesk® Structural Bridge Design structural model. It does not give any assistance in creating models specifically for dynamic analysis where an understanding of dynamic behaviour is required.
This is essentially a very simple model as all the structural material is the same and has the same density. When composite beams are used where there is a mixture of materials and densities, then a transformed density will be required. If composite beams created by Autodesk Structural Bridge Design are used in the analysis then this transformed density is calculated automatically.