3.9 Bending/Axial Interaction Surfaces/Curves
Subjects Covered
- Reinforced concrete column
- General Stress/Strain Sections effective lengths
- Slenderness moments
Outline
Using three pre-prepared section files this example examines the interaction diagrams for bi-axial bending and axial forces at Ultimate Limit state and demonstrates how these can be used to obtain factors of safety on a number of permanent and variable load cases.
One part of the example shows how this can be applied to prestressed sections and another shows how it can be used on steel sections for fully plastic moments.
| EU Example 3.9a | Notes |
|---|---|
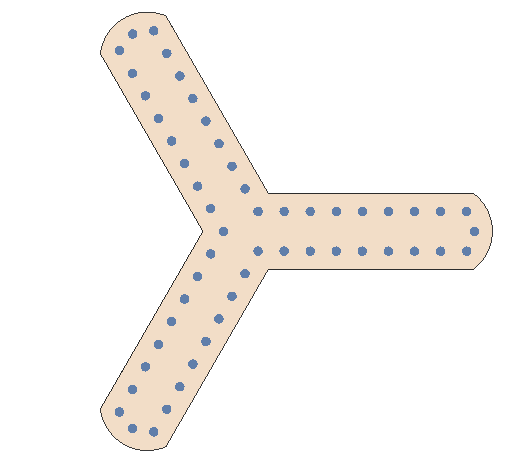 |
This three armed column section file is provided with one permanent load case and four variable load cases. Append the permanent loads into the four live load combinations. Create the interaction surface with 90 NA increments and 50 strain increments and display the 3D shape for all load cases. Determine a table of factors of safety on the variable load for all load cases. Create an interaction curve along the variable load vector in a vertical plane for the first variable load case. |
| EU Example 3.9b | Notes |
|---|---|
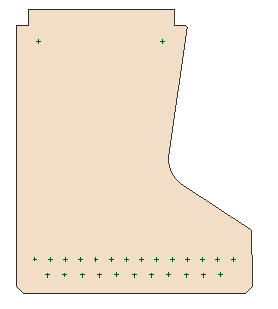 |
This section file contains a standard YE5 prestressed section with the bottom two rows and the top row fully stressed with default prestressing strand (horizontal top branch of stress strain diagram). Create an interaction surface using 90 NA increments and 50 strain increments. Produce graphical displays for both elevations and plan. Export the surface results to a spreadsheet and sort the data to establish maximum and minimum values of My bending, Mz bending and axial force. Examine the effect on these values if the prestress is set to zero |
| EU Example 3.9c | Notes |
|---|---|
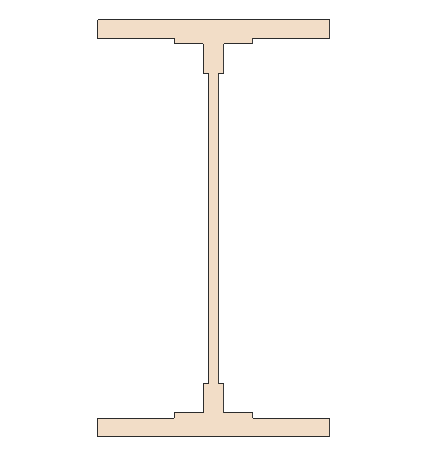 |
This steel plate girder section file was created in section 3.1 of this example manual and the unused material deleted. It is required to establish if the standard interaction curves for ULS analysis would be appropriate to represent the fully plastic resistance of the section. Analyse for plastic section properties to establish Mult,p in both My and Mz directions together with the section area to establish the plastic axial resistance. Create 3 load cases with the My, Mz and axial forces from above. The interaction surface analysis should show the factors of safety to be 1.0 in each direction Create a fourth load case with permanent values of My = 2200kNm, Mz =0kNm, Ax = 3042kN and variable load values of My = 3500kNm, Mz = 517kNm and Ax = 4850kN. What is the plastic factor of safety for the variable loads |
Procedure
Three Armed Column
Start the program, close the Home using the
ESCkey and open the supplied data file “EU Example 3_9a.sam” via the menu item Help | Tutorials | Open Tutorial Model.Use the File | Titles menu item to enter your initials in the Calculations by: field.
Click the ✓ OK button to close the Titles form. In the navigation window you will see 5 loadcases that have already been created. The first contains all the permanent load effects and the others contain different combinations of variable load effects. It is required to append the permanent loads into each of the variable loadcase tables.
Select the “Permanent Load” case to open the Define Loadcase form. In the lower table, right mouse click and select Copy Table to Clipboard before closing the form with “✓ OK."
Open the second load case data form and right mouse click in the bottom table. From the context menu select Paste From Clipboard (Append) to add the permanent load effects and then close the form with “✓ OK."
Repeat this for the remaining three load case tables.
From the navigation window toolbar select the
 Analyse dropdown and select Interaction Surface... to open the Interaction Surface form.
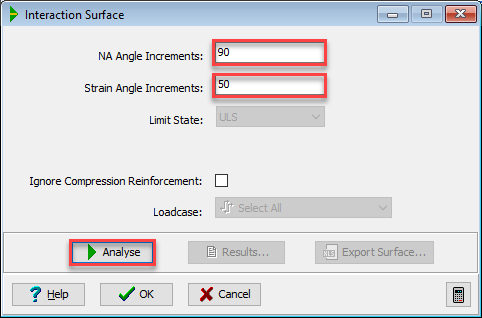
Set the NA Angle Increments: field to “90” and the Strain Angle Increments field to “50” before clicking on the Analyse button.
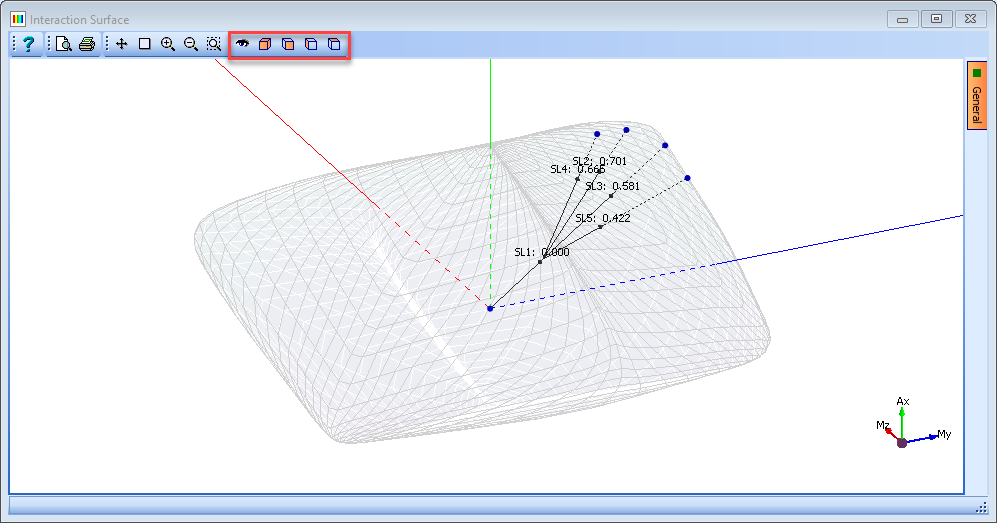
The graphics then displays the 3D interaction surface together with vectors representing both permanent and variable components of each load case. The variable vectors are extended until they intersect with the surface. The performance ratio of each of the variable vectors is also shown on the diagram Different and dynamic views can be obtained using the buttons in the toolbar.
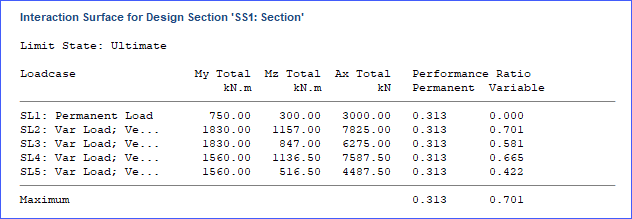
In the Interactive Surface form click on the Results... button to open the Results Viewer. This will provide a table of loadcases with the applied load effects and performance ratios. (Note the Factor of Safety is 1/performance ratio).
Close the Results Viewer.
To take a slice through the interaction surface a particular load case is selected in the data form and the boundary curve is drawn on a plane which is vertical and directed along the variable vector of the load case. In the Interaction Surface form select “SL2:” in the Loadcase field.
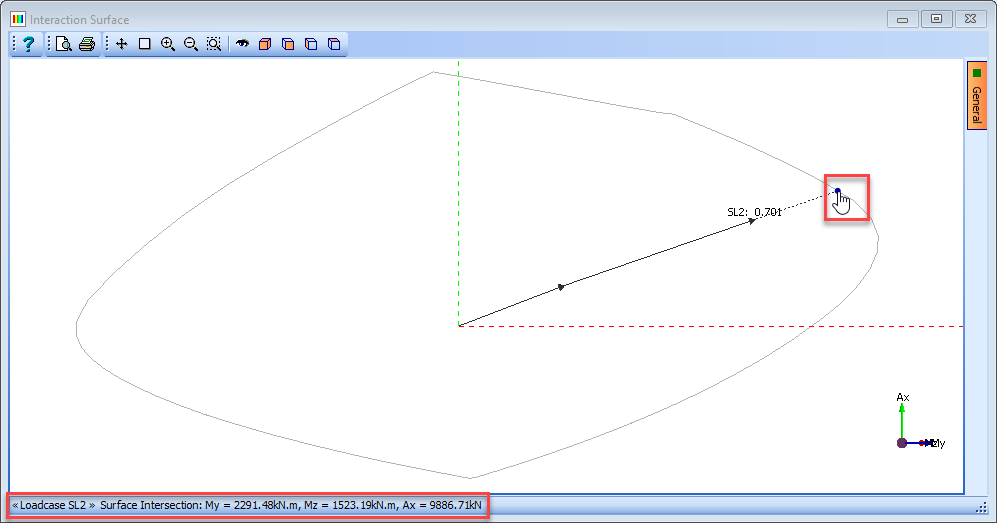
If the cursor is placed over the blue intersection point the moment and force values are shown in the status bar at the bottom of the graphics window.
Use the ✓ OK button to close the Interaction Curves form.
Use the File | Save As... menu item to save the data file to “My EU Example 3_9a.sam” and click on the “Save” button to save the data file.
Prestressed YE Beam
Use the File | Open menu item to open the file “EU Example 3_9b.sam”.
Use the File | Titles menu item to enter your initials in the Calculations by: field.
Click on the ✓ OK button to close the Titles form.
From the navigation window toolbar select the
 Analyse dropdown and select Interaction Surface... to open the Interaction Surface form.
Set the NA Angle Increments field to “90” and the Strain Angle Increments field to “50” before clicking on the Analyse button.
In the graphics window change the viewing angle to My-N view using the graphics toolbar buttons. It is required to determine the max and min My moment with zero axial force and zero Mz moment, as shown below.
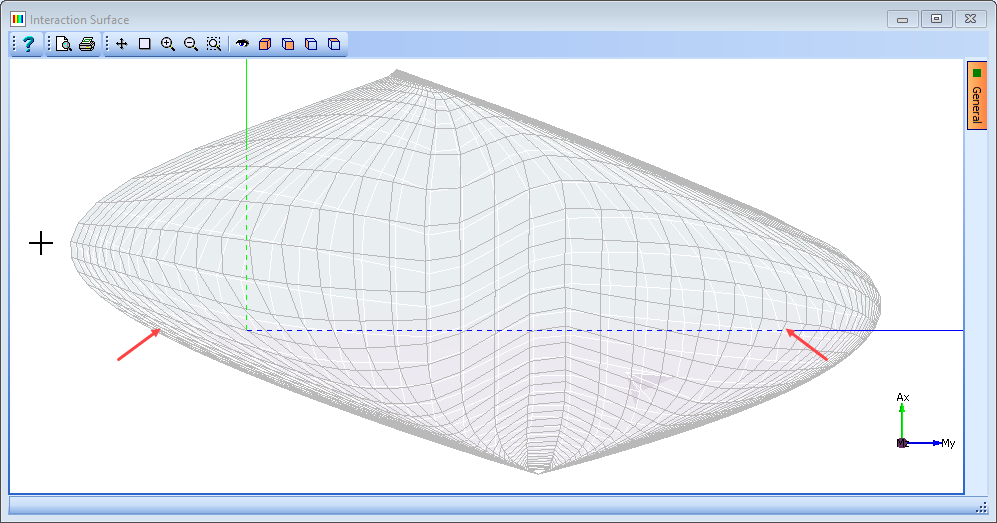
To do this, we need to create two load cases, one with a nominal +My moment and the other with a nominal –My moment.
Click the ✓ OK button to close the Interaction Surface form.
In the navigation window use the
 toolbar button to add a Loadcase...
Change the Name to “Nominal +My” and enter a value of “1000” in the Ultimate | My field before closing the form with the ✓ OK button.
Repeat this for a second load case, naming it “Nominal –My” and entering a value of “-1000” in the Ultimate | My field.
Open the Interaction Curve form again, as before, and Analyse.
Selecting Loadcase: SL1 Nominal +My in the data form changes the graphics to a section view with the plane of the section being along the My axis and vertical.
Moving the cursor over the intersection point displays the My value at the bottom of the window – which is 3469kNm. If the load case is changed to the – ve My case then the My value at the other end is -575kNm. Close the Interaction Surface form with the ✓ OK button.
To examine the effect of reducing the prestressing force to zero it is necessary to open the tendon definition form and change the tendon forces to 0.0.
Select Tendons in the navigation window and in the Define Tendons form click on the Edit tendon... button.
Draw a box around all the tendons in the graphics window and in the Edit Tendons form change the Edit Option: to “Change Force” and set the Tendon Force: value to “0.0” before closing both forms with the ✓ OK button.
Repeat steps 24, 25 and 26 to get a +My value of 2640kNm and a –My value of -841kNm.
Before closing the Interaction Surface Form change Loadcase: to “Select All” and then click on the Export Surface... button to save the results into a spreadsheet.
The spreadsheet can be opened and the data sorted with respect to one of the columns – for example, My – so the largest and smallest values can easily be found together with associated Mz and Ax values. This output is also very useful if you wish to carry out your own post-processing on these results.
Close the Interaction Surface form for with the ✓ OK button and then use the File | Save As menu item to save the data file as “My EU Example 3_9b.sam”.
Steel Plate Girder
Use the File | Open menu item to open the file “EU Example 3_9c.sam”.
Use the File | Titles menu item to enter your initials in the Calculations by: field.
Click on the ✓ OK button to close the Titles form.
From the navigation window toolbar select the analyse dropdown and select Section Properties... to open the Section Properties form.
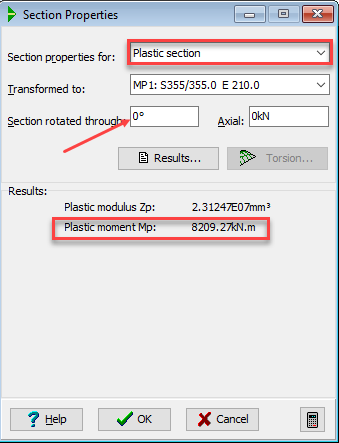
Change Section Properties for: to “Plastic section” and note that the Plastic moment about the major axis is 8209.27kNm.
Rotate the section through 90 degrees by changing the angle on the section properties form and note that the Plastic moment about the minor axis is 1881.99kNm.
Change the Section properties for: to “Gross section” and note that the cross section area is 63024mm². If the yield stress is 355N/mm² then the ultimate plastic axial force is 355 x 63.024 = 22373.52kN.
In the navigation window use the
 toolbar button to add a Loadcase....
Change the Name to “My 8209.27” and enter a value of “8209.27” in the Ultimate | My field before closing the form with the ✓ OK button.
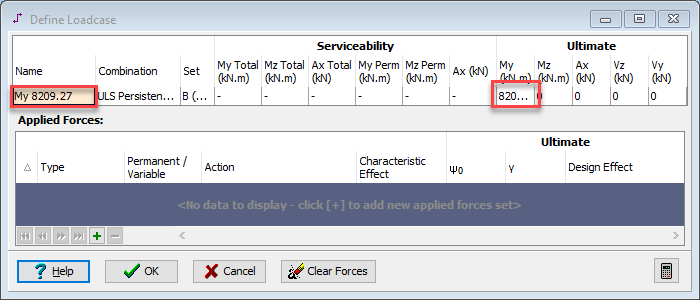
Repeat this for Mz 1881.99 and Ax 22373.52 so that there are three loadcases.
From the navigation window toolbar select the
 Analyse dropdown and select Interaction Surface... to open the Interaction Surface form. To increase accuracy (at the expense of analysis time) the No. of NA Angle Increments is set to 180 and the No. of Strain Angle Increments to 65.
Click on the Analyse button and inspect the graphical results.
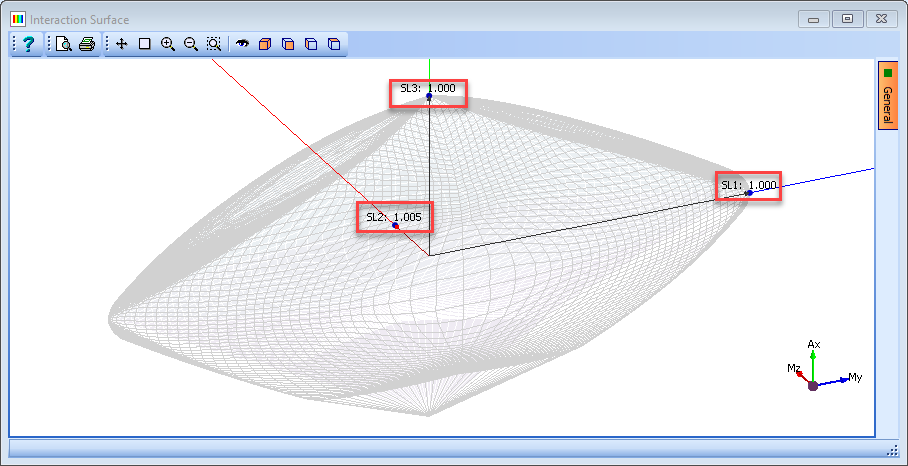
Both the My and the AX load cases have a performance ratio of 1.000 which indicates that the intersection points are a good representation of the plastic limits. With Mz there is a small error of 0.6%, which can be attributed to two things:
- The straight line interpolation between surface points.
- With the method used in the interaction surface calculations the strain plane at the NA can never be exactly horizontal, as in a plastic analysis assumption, as the strains can never be infinite. However, the limiting strains of +/- 0.1 give a reasonably good solution, especially when the section orientation places very little material at the NA, as in the My case.
Close the Interaction Surface data form with the ✓ OK button and then use the File | Save As menu item to save the data file as “My EU Example 3_9c.sam”.
Close the program.
Summary
This example demonstrates how to create MX/MY/Axial interaction surfaces for a variety of different sections and load case effects.
Although the facility for creating 2D interaction curves is still available, and of use in many situations, the interaction surface is very powerful in determining ULS factors of safety for several sets of applied load effects in a section, especially if they are applied in sets of permanent and variable actions.
The example also demonstrates how to extract a 2D interaction curve in a particular plane from the surface results.