Performance Tracking
Performance tracking allows you to analyze how planned and actual performance influence each other by examining tracked input (time units) and output (units of work completed). This insight helps you address labor issues on the jobsite and accurately forecast any cost impacts at the earliest opportunity.
Click each of the tiles to learn the performance tracking workflow:
Create Performance Tracking Item from the Budget
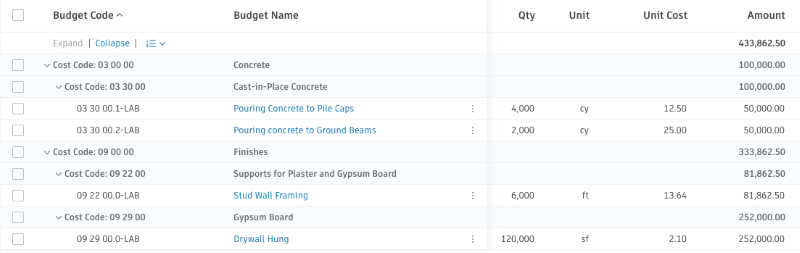
Tracking items are created from a budget. To start working with the Performance Tracking workflow, you need to have a budget added with the budget code segments defined. Add unit, quantity, unit cost, and the amount of the budget you want to perform tracking on.
To add a tracking item:
Select the Forecast tab in Cost Management.
Switch to the Performance Tracking tab.
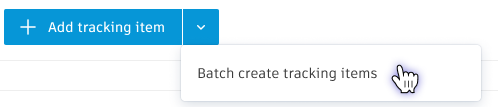
Select Add tracking item or Batch create tracking items from the drop-down menu.
Search by Budget Code and choose the budget or budgets that you want to track.
The selected budget is added as a tracking item with an automatically assigned instance. You can plan input and output, and track actuals to monitor labor performance.
To connect labor data to budget codes, select Add tracking item. Then, select the budget codes from the drop-down list.
Add an Instance
Add an instance by selecting the More menu  next to the tracking item and then the Add Instance option. This action may be helpful when you want to break down a tracking item. For example, you have several locations under one budget and want to track performance on all of them.
Update Item Details
When a tracking item and its instance are created, you can update instance details to adjust the tracking. You can:
- Edit the name or number of the instance and add a location of the instance in the General section of the table.
- Edit the fields in the Plan section to adjust the planned performance.
- Add values in the Tracked section to keep up with the work progress.
Logging progress daily or weekly helps to monitor performance ratio in real time. You can also automate logging the progress timesheet by integrating Cost Management with third-party tracking apps.
Monitor Performance Ratio
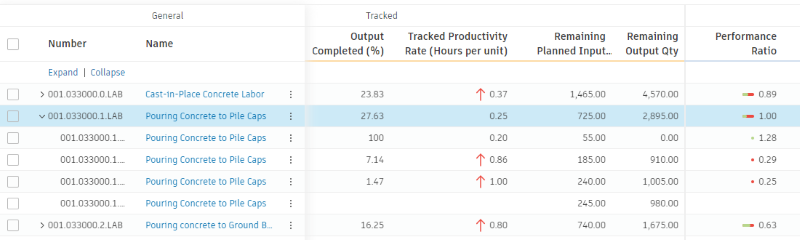
Every time you update a tracking item instance with current values, you can see the changes in the Performance Tracking table. The table allows you to monitor the relationship between planned and tracked performance in three views, which you can change according to the type of work:
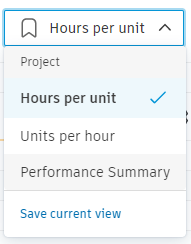
While the first two are more detailed, the Performance Summary view shows the simplified data:

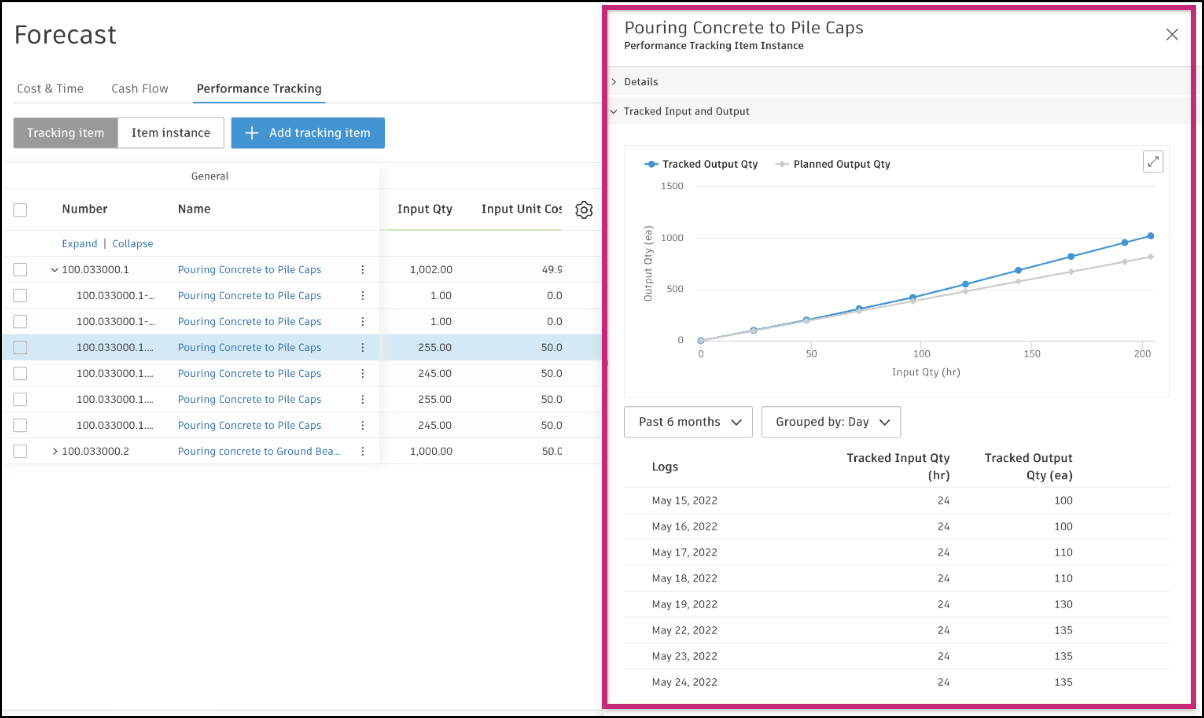
For more insights, open the flyout panel to view detailed logs and charts:
Performance Ratio
You can see if your team on the jobsite is:
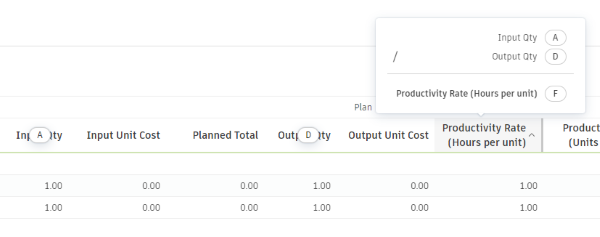
- On track, when Productivity Rate (hours per unit) divided by Tracked Productivity Rate (hours per unit) is equal to 1. This is shown by the green dot on the instance in the Performance Ratio column.
- Overperforming, when this ratio is greater to 1, which is indicated by the green dot.
- Underperforming, when this ratio is lower than 1, which is shown by the red dot.
For example, the planned productivity rate is three hours per installation of one window. If the tracked productivity rate is two hours per window, the ratio is greater than 1 – your team is overperforming.
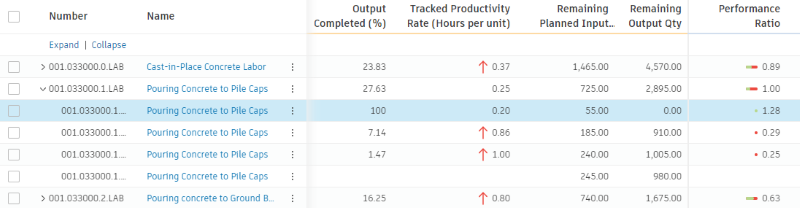
In the Performance Ratio column, you can also see the progress bar, which shows the performance of the tracking item. The color of the progress bar is calculated by the proportion of performance on the instances. Even if the progress bar shows 1.00, one of the instances may be overperforming, while others may be underperforming. You can dive into details to view the actual performance in each instance.
Add Forecast Adjustment from a Tracking Item
The forecast section within the table calculates the required performance to help keep you on track. It also shows any variances from the plan. The system will forecast an indicative end cost by using actual trending costs to date and calculated variance.
You can add a forecast adjustment from a tracking item when you see any issues in the performance and want to adjust the budget accordingly.
To add a forecast adjustment:
Select the Forecast tab in Cost Management.
Switch to the Performance Tracking tab.
Select the More menu
next to the tracking item.Choose Forecast Adjustments. The Edit Forecast Adjustments window shows. You can select one of the two options:
- Add – to manually add an adjustment.
- Add from Tracking Item - to choose from the existing tracking item. The adjustment is calculated by multiplying the additional hours needed to complete the task (based on tracked performance, or Forecast Input Qty Variance) by the latest approved price per hour (Trend Unit Cost). This reveals the extra costs required.
Tip: You can add as many forecast adjustments as you want.Once ready, exit the window. Adjustments are added at once.
You can view your forecast adjustments in various budget-related sections. For instance, they are visible in the Forecast Adjustments section within the details panel of the budget.
