Personalize Cost Management Home
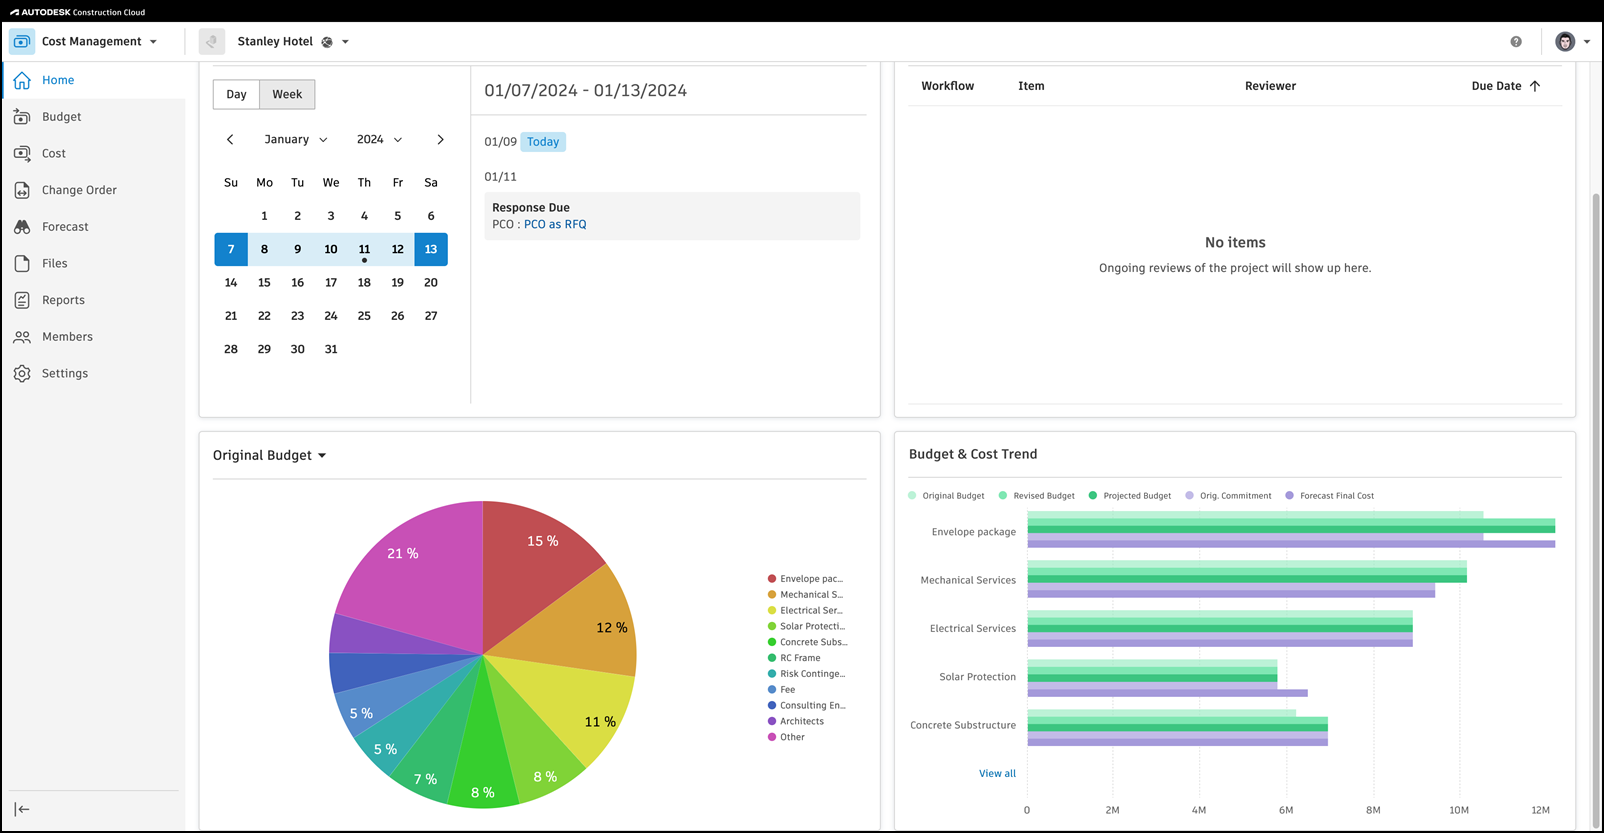
The Cost Management home page provides a quick overview of the financial status of your project. Data is automatically collected and calculated, and is displayed in graphs that show metrics such as time and cost.
The home page will be displayed when you open a project in Cost Management.
Home Page Card Library
Cost Management Home Page can be customized by adding, removing, and reorganizing cards.
To customize the Home Page click Customize on the top right corner. Now you can:
Add Cards – Click the Card Library button, select the card, then click the Add Card button.
Tip: You can add multiple different cards at a time. You can also add another instance of the same card when you reopen the Card Library.Reorder Existing Cards – Simply drag the card to the preferred location.
Remove a Card – Click the More menu in the top right corner of a card to remove it from the Home Page.
Available Cards
Calendar

This section displays items with associated dates. If there is no content yet, you can start assigning dates to fill out your calendar. The dot under the date highlights significant dates for the project, such as the contract on-site date or RFQ response due date.
The Calendar card allows you to:
- Toggle between Day and Week views
- Use the < > arrows to navigate through months
- Select a month and year from the drop-down list
- Click a link to directly open up the item
Project administrators can manage the visibility of dates in the Budget, Cost, and Change Order settings. You can also create relative dates for custom attributes and custom columns.
Reviews

This card displays items currently in review for all custom approval workflows. If you have a View All or higher permission, you can view the current active workflows, related item links, the names of the reviewers, and due dates.
- The due date in red indicates that an item is past due.
- If you have the appropriate permission, you can click links to directly open the item.
- Click the
 icon to filter by reviewer name.
 - Click the Workflow or Due Date columns to sort the data in ascending or descending order.
Budget Charts

This section contains several pie charts that display the percentage of money in each budget relative to the total project amount. Click a budget name to show or hide it from the chart. Click the ![]() icon to check when the chart was last updated. The available views in this section are:
icon to check when the chart was last updated. The available views in this section are:
- Original Budget - This chart shows the budgets in your project based on their original value, which was added when the budget was created. This data is collected from the Original Budget column in the Budget tab. Learn more about importing or entering budgets.
- Revised Budget - This chart shows the sum of the Original Budget, Internal Budget Transfer, and Approved Owner Changes columns for each budget in the project and how it relates to the total project. This data is collected from the Revised column in the Budget tab.
- Projected Budget - This chart shows the sum of the original budget, approved, and pending changes for each budget in the project, presented as a percent. This data is collected from the Projected Budget column in the Budget tab.
- Original Commitment - This chart shows either the anticipated or contracted amount for the relevant supplier scope. This data is collected from the Orig. Commitment column in the Budget tab.
- Forecast Final Cost - This chart shows the final projected cost as the sum of the projected costs and forecast adjustments. This data is collected from the Forecast Final Cost column in the Budget and Contract tables.
Each pie chart presents the amount of money in each budget as a percentage of the whole project, where several budgets exist. To better understand how data is automatically collected and calculated, see the Budget and Contract Tables article.
Budget and Cost Trend Chart
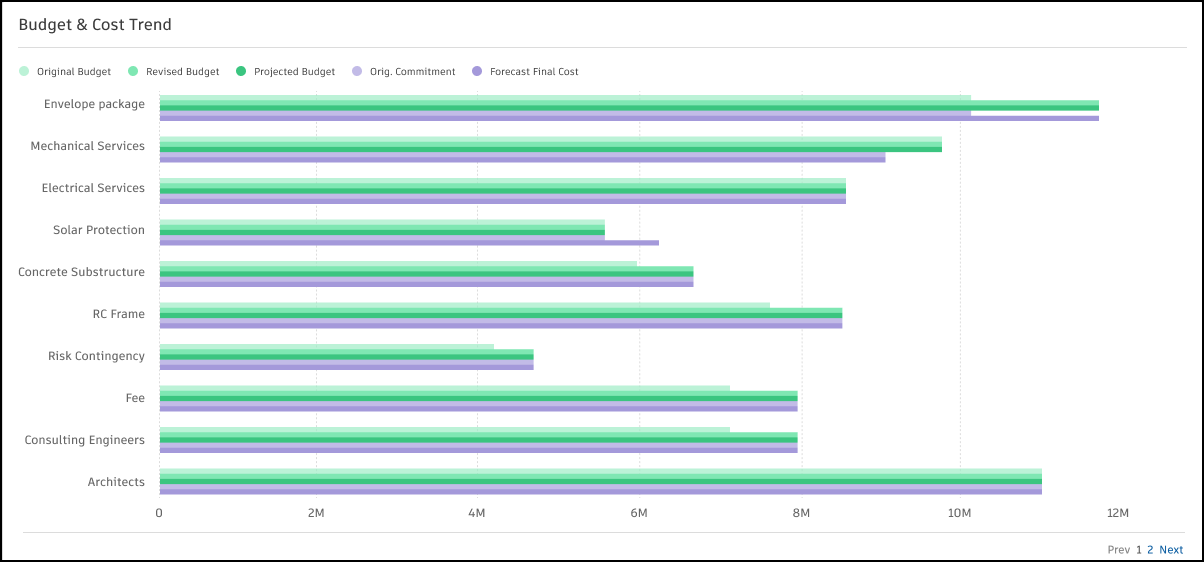
The Budget and Cost Trend Chart provides a quick and easy way to track changes in your project's budgets and cost over time.
Toggle items in the chart legend (Original Budget, Revised Budget, Original Commitment, Forecast Final Cost) of a bar chart or pie chart to choose what to display in the card.
To permanently save a view of the card, modify it in the Customize mode and click Save.
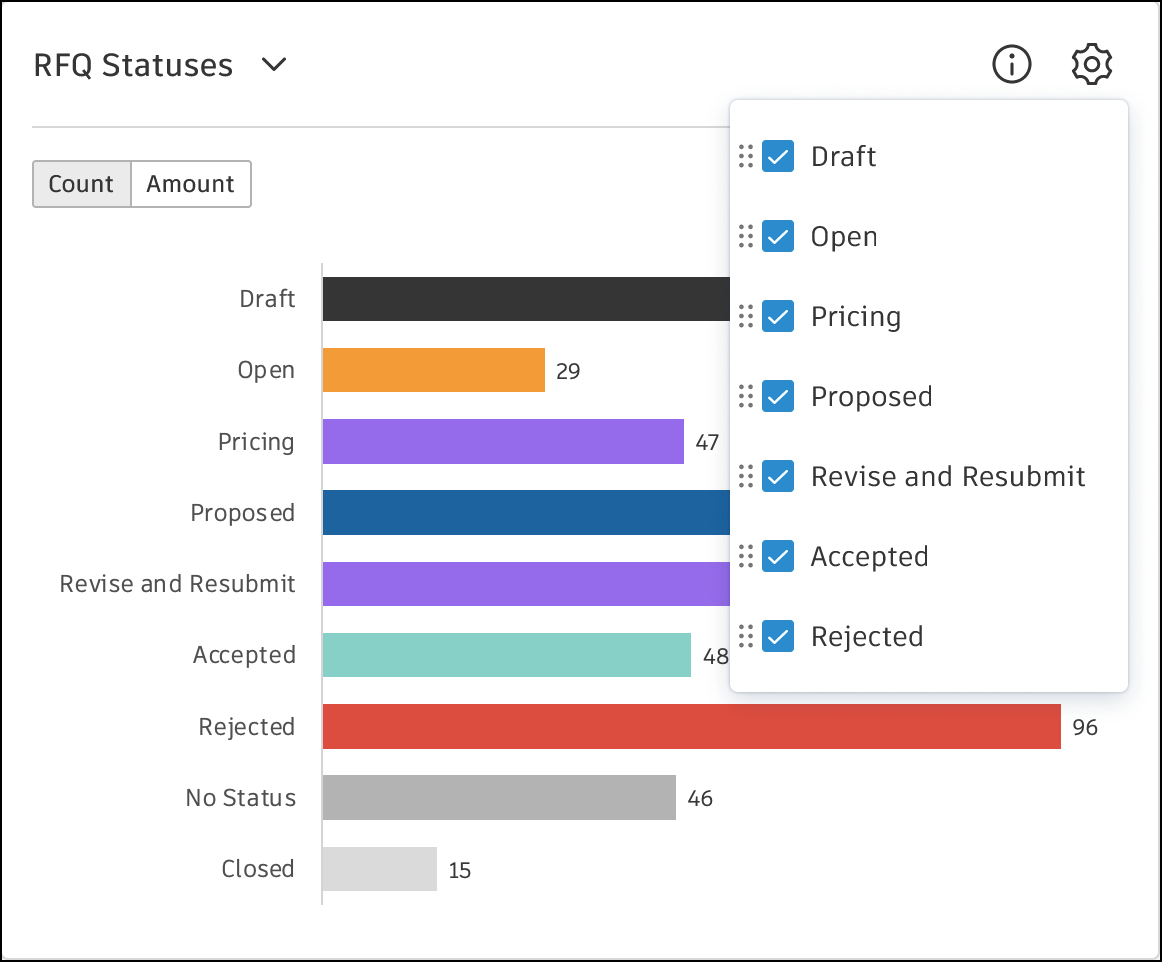
Response Due Tracker
![]()
This card displays bar charts representing the number of due items in the project. These bars are segmented to visually indicate the number of items in different due statuses.
The menu displays all tabs containing items with a Response Due attribute. Members can select or deselect menu items to toggle the display of their corresponding bar charts.
Change Order Statuses
This feature brings visibility and customization to managing change orders. Here’s what you can do with this functionality:
- Status Information: View detailed information on the various statuses of change orders, enabling better tracking and management.
- Change Order Types: Switch between different types of change orders to get the specific insights you need.
- Count & Amount Views: Toggle between viewing the count and the amount associated with each status.
- Hide/Show Statuses: Customize your view by hiding or showing individual statuses.
- Sequence Arrangement: Organize the sequence of statuses for each type of change order to prioritize and streamline your workflow.
- Settings Memory: Settings are remembered in the Home page customize mode.
SCO and OCO Impact
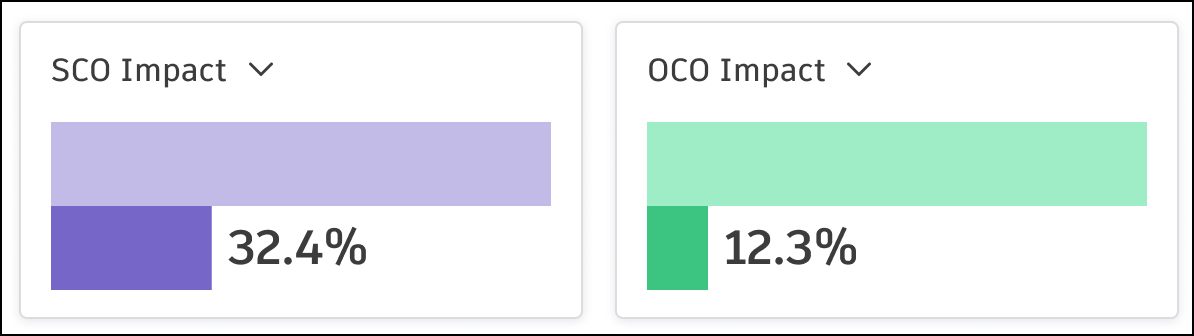
The change impact cards are tools designed to measure the impact of change orders on the original plan. Members can select specific metrics to calculate these impacts. There are two types of cards:
- SCO Impact: This card includes total metrics such as Contracts after Sent and Contracts after Executed (default). It also tracks change metrics like SCOs after Sent and SCOs after Executed (default).
- OCO Impact: This card features total metrics such as Total original budget and Total Main Contract scheduled value (default). The change metrics include OCOs after Approved and OCOs after Executed (default).
Percentage impacts are calculated based on the selected metrics, and visualized using bars to represent these percentages.
Average OCO Approval Time and Average SCO Execution Time
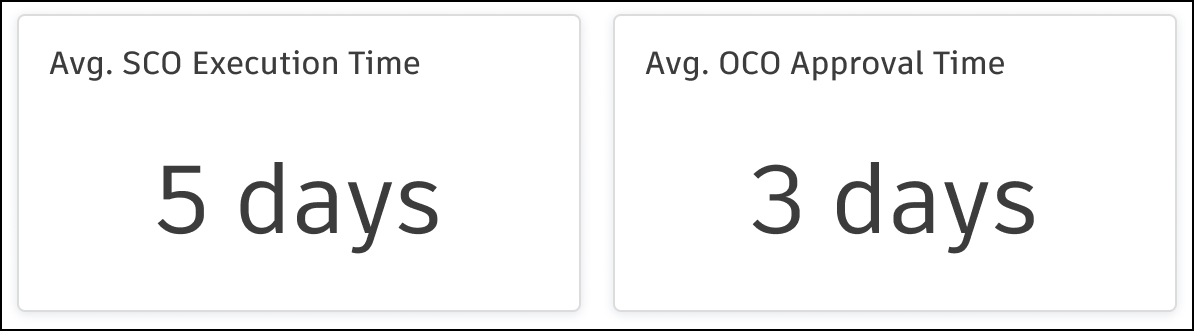
This card displays the average time taken for the approval of OCOs and the execution of SCOs within a project. It provides insights into the efficiency of the change order processes by showing how long, on average, it takes to complete these tasks.