Convergence Plot Analysis
The Convergence Plots dialog gives other perspectives during optimization.
To open the Convergence Plots dialog, click  on either the Violation tab or Cut-fill tab of the Optimization Panel.
 Convergence Plots on the Optimization Toolbar to open the dialog.
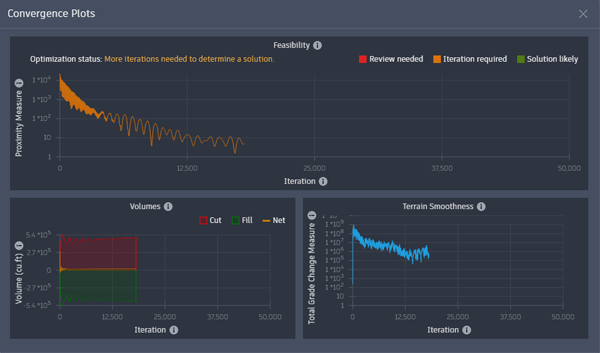
Feasibility. Be sure the feasibility line is tracking downward. If it levels off before reaching zero, the desired constraints and objectives cannot be met 100%. Review problem areas in the Violation View, and reassess your plans.
The optimization status at the top of the chart indicates the probable solution status as a color-coded message above the chart.
- Green. Trending toward an optimal solution. This shows the optimization will likely be successful.
- Orange. More iterations need to determine a solution. This prompts that more time is needed to determine if hte solution is viable.
- Red. Review needed. This indicates there are too many conflicts for a reasonable optimization and requires that the global and object constraints need to be adjusted. The grading object locations may need to be modified as well depending on the project.
The feasibility line in the chart also displays these colors as it processes.
Volumes. Limiting earthwork is a project objective. This chart helps you identify any fill that needs to be brought in, or cut that needs to be removed from the site. This chart identifies both and tracks a net volume. The net volume target is zero by default, but it can be specified in the Optimization Options dialog. Under the Objective Weights section, specify the Cut-Fill field for the Balance Cut and Fill option.
Terrain Smoothness. This chart tracks the optimization attempts to minimize the grade change between adjacent triangles on the surface.

Observing the optimization in the Convergence Plot allows to you to see when fewer changes to the surface elevations are occurring. In these cases it may make sense to stop the optimization instead of waiting for only a slightly better result.