Create an Analysis in Insight Builder to Visualize Your Autodesk Forma Data
An analysis is a draft version of the dashboard which has not been published yet and can only be accessed by members with the Author permission level. Refer to the Insight Builder Terminology for more terms specific to Insight Builder.
Create visuals, calculated fields, add filters, and arrange the layout of visuals to highlight the important items, metrics and analytics for individual projects, or across the projects.
Create an Analysis from a Dashboard Template
Authors can create an analysis with relevant Autodesk Forma data to share it with other members.
Click Dashboards from the left navigation in Insight Builder.
Click the relevant dashboard.
Click Save as in the top right of the page to create an analysis.
Enter a name for your analysis, and click Save.

Create an Analysis from a Dataset
Click Datasets from the left navigation in Insight Builder.
Click the More menu
 on the right of the relevant dataset and click Create analysis.
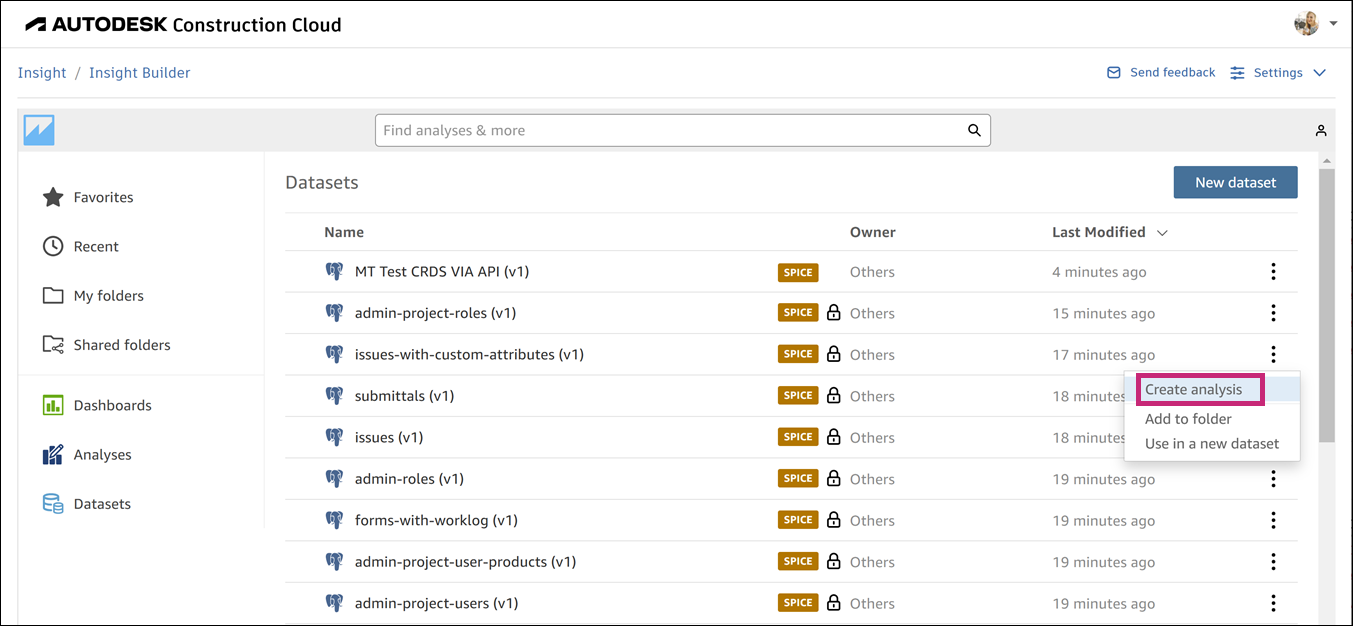
Configure an Interactive Sheet
When you select an interactive sheet, you must select the type of layout and canvas size you want your sheet to be optimized for.
Type of layout
The type of layout can be one of the following:
- Free-form
- Tiled
Canvas size
Use the Optimize for viewing on drop-down menu to select the desired canvas size.
See Configure Interactive Sheets in Insight Builder for more information.
Configure a Pixel-perfect Report
When you select a pixel-perfect report, you must choose the paper size and report orientation.
Paper size
Use the Paper size drop-down menu to select the desired paper size.
Sheet orientation
Select the desired sheet orientation: Portrait or Landscape.
See Create and Configure Pixel-Perfect Reports for more information.